Picture a godown holding ₹50 lakh of stock. Sales are steady. The shelves look full and healthy. Yet every day, that stock quietly drains money from your business.
Rent, loan interest, insurance, power, damaged cartons, items that never sell. None of it appears as one neat line in your books. That is why inventory carrying cost is one of the most overlooked expenses in Indian business.
In this guide, you will learn:
- What carrying cost means, and how it differs from holding cost
- The inventory carrying cost formula, step by step
- The four components, with worked rupee examples
- What pushes the cost up in India: interest rates, rent, GST and festive stocking
- Eight practical ways to bring it down
- How to build a simple calculator in Excel or Google Sheets
Let’s start with the basics.
What Is Inventory Carrying Cost?
Inventory carrying cost is the total expense of keeping unsold stock for a period of time. Most businesses show it as a percentage of average inventory value per year.
Think of it like parking a car. The car may be worth ₹8 lakh. But parking fees, insurance and the EMI keep running whether you drive it or not. Stock behaves the same way.
You will often hear “carrying cost” and “holding cost” used for the same thing. In most business writing, they are interchangeable. Some textbooks use holding cost for the per-unit figure and carrying cost for the total. Either way, the question is identical: what does it cost to keep this stock?
Carrying cost is also bigger than storage cost. Storage is only one slice. Capital, service and risk costs sit beside it. In India, the capital slice is often the largest.
Why it matters: suppose a product earns a 15% margin and carries a 25% yearly cost. It starts losing money if it sits for more than about seven months. The margin looks fine on paper. The holding cost quietly cancels it.
The Inventory Carrying Cost Formula
The formula is simple:
Carrying cost (%) = (Total annual carrying cost ÷ Average inventory value) × 100
The total is the sum of four parts:
Total carrying cost = Capital cost + Storage cost + Inventory service cost + Inventory risk cost
How to calculate it, step by step
- Find your average inventory value. Add opening and closing stock value for the year and divide by two. If your stock swings with the seasons, use a monthly average instead.
- Add up each of the four costs for the same 12 months. Use real numbers from your books, rent agreement and loan statements.
- Total them. This is your annual carrying cost in rupees.
- Divide by average inventory value, then multiply by 100. This is your carrying cost percentage.
One catch: your valuation method changes the average inventory value you use. When prices rise, FIFO and weighted average can give quite different figures. Ind AS 2 does not allow LIFO, so most Indian businesses use one of the other two. Our guide to FIFO vs LIFO vs weighted average inventory valuation shows how each one changes the number.
The per-unit version
Sometimes you need the cost for one SKU rather than the whole godown.
Carrying cost per unit per year = Carrying cost % × Unit cost
If a tile costs ₹200 and your carrying cost is 25%, holding one tile for a year costs ₹50. That is roughly ₹4 a month. Small numbers like this make pricing and reorder decisions much clearer.
The 4 Components of Inventory Carrying Cost
Each component behaves differently. Some are easy to spot. Others hide in plain sight.
1. Capital cost
Money locked in stock cannot be used elsewhere. You either pay interest on borrowed funds or give up the return that cash could have earned.
In India, this usually includes:
- Interest on cash credit or working capital limits
- Interest on MSME or term loans used to buy stock
- Opportunity cost, meaning what that cash could earn if it were free
Check your own sanction letter. Banks and NBFCs add a spread above the repo rate, and small businesses often pay double-digit rates. For this guide, we assume 12%.
Example: ₹50 lakh of stock at 12% costs ₹6 lakh a year.
2. Storage cost
This is the cost of space and everything needed to keep it running.
- Warehouse or godown rent
- Electricity, cooling and racking
- Security and housekeeping
- Labour for moving and stacking goods
Rent per square foot varies widely by city and micro-market. A shed in Bhiwandi costs very differently from one near Bengaluru or Gurgaon. Cold storage costs more again.
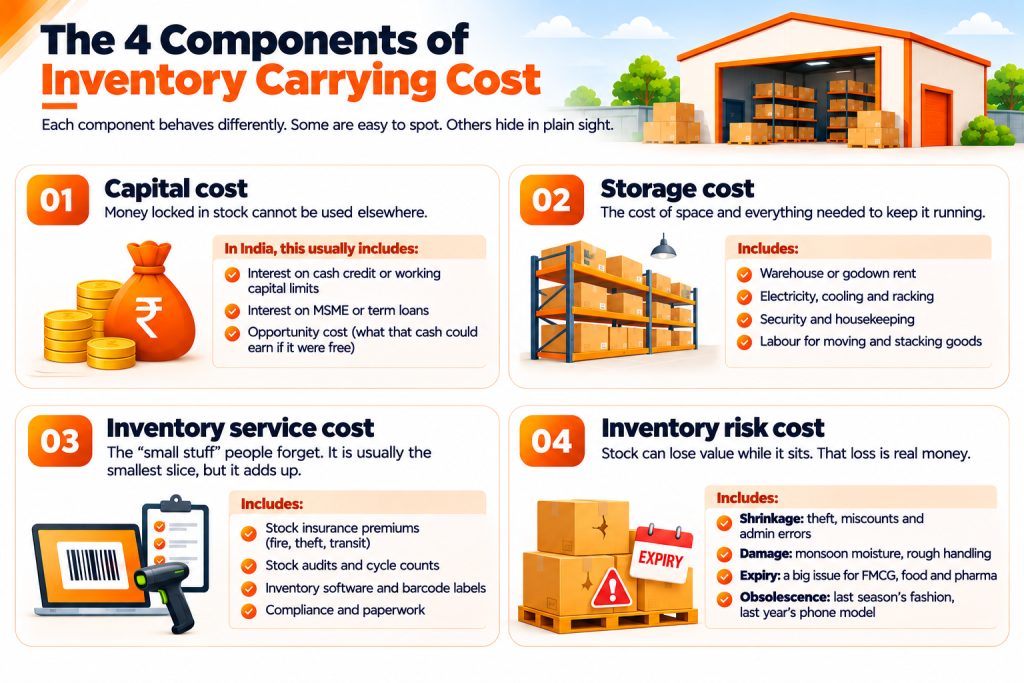
3. Inventory service cost
This is the “small stuff” people forget. It is usually the smallest slice, but it adds up.
- Stock insurance premiums (fire, theft, transit)
- Stock audits and cycle counts
- Inventory software and barcode labels
- Compliance and paperwork
4. Inventory risk cost
Stock can lose value while it sits. That loss is real money.
- Shrinkage: theft, miscounts and admin errors
- Damage: monsoon moisture, rough handling, forklift accidents
- Expiry: a big issue for FMCG, food and pharma
- Obsolescence: last season’s fashion, last year’s phone model
Old stock is where this cost grows fastest. Our guide to dead stock in inventory explains how to spot it early and clear it.
Inventory Carrying Cost Example in Rupees
Let’s put numbers on it. Imagine a distributor with an average inventory value of ₹50,00,000. This is an illustration, so swap in your own figures.
| Component | What is included | Annual cost |
|---|---|---|
| Capital cost | 12% interest on ₹50 lakh | ₹6,00,000 |
| Storage cost | Rent (2,000 sq ft at ₹18 per sq ft per month) ₹4,32,000, plus power and security ₹48,000 | ₹4,80,000 |
| Inventory service cost | Insurance ₹30,000, software and audit ₹50,000 | ₹80,000 |
| Inventory risk cost | Shrinkage, damage and expiry at about 4% | ₹2,00,000 |
| Total | ₹13,60,000 |
Carrying cost percentage = ₹13,60,000 ÷ ₹50,00,000 × 100 = 27.2%
That works out to about ₹3,700 every single day, just to keep the stock sitting there.
Now see what happens if you free up ₹10 lakh of slow stock. Capital and risk costs fall at once, at roughly 16% combined. That saves about ₹1.6 lakh a year. Rent only drops if you also release space. So connect stock cuts to space decisions.
Inventory Carrying Cost Calculator
See what your stock really costs you each year
Why Indian Businesses Often Pay More Than They Think
Global articles quote a flat 20% to 30% and move on. Indian businesses face a few extra pressures.
Interest rates are moving up
On 7 October 2026, the RBI raised the repo rate by 25 basis points to 5.50%. You can read the official decisions on the Reserve Bank of India website. A quarter point looks tiny. Yet on ₹50 lakh of stock, it adds about ₹12,500 a year if your loan reprices fully. A rising-rate period is the right time to check your capital cost.
Rent keeps climbing
Demand from e-commerce, 3PLs and quick commerce keeps pressure on warehouse rents near big cities. Many SMEs also pay for space they do not fully use. Every empty rack is still billed.
GST can turn waste into a double loss
Under GST rules, input tax credit is generally not allowed on goods that are lost, stolen, destroyed, written off or given away as free samples. Credit already claimed has to be reversed. So dead stock costs you the goods and the tax. Confirm the details with your CA and the GST portal.
Festive stocking leaves a hangover
Indian demand spikes around Diwali, Dussehra and big marketplace sales. Businesses stock up early. When the spike ends, leftovers sit through the slow months and keep costing money. Seasonal categories like fashion feel this most.
Marketplace and quick-commerce fees
Online sellers often pay storage fees at fulfilment centres. Dark stores use small spaces with high rent per square foot. In both cases, extra days of stock cost more than they would in a regular godown.
What Is a Good Inventory Carrying Cost Percentage in India?
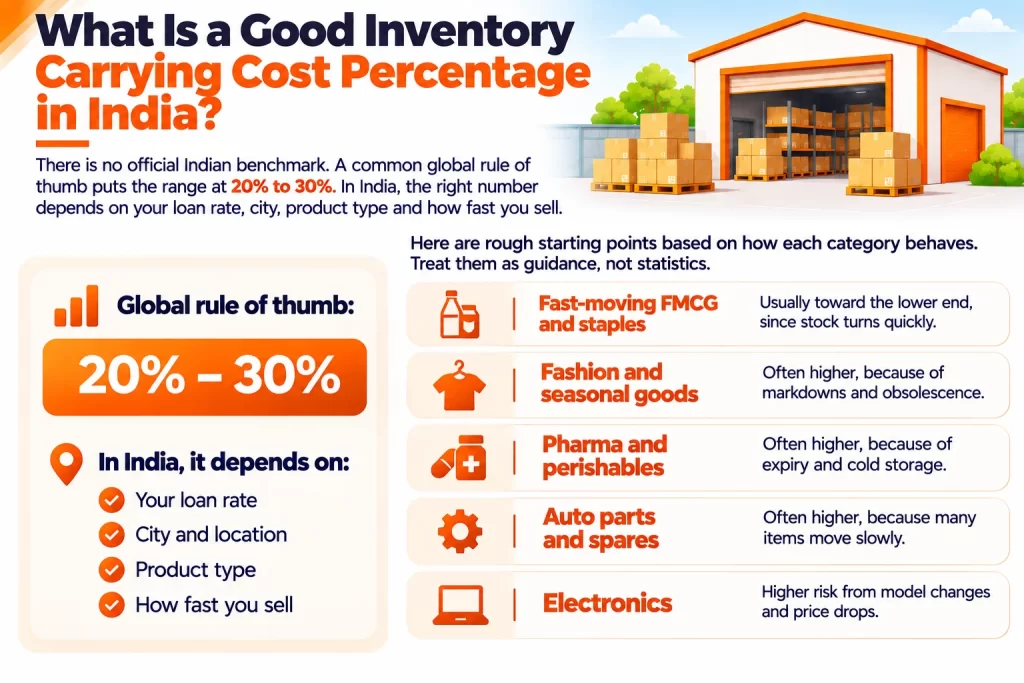
There is no official Indian benchmark. A common global rule of thumb puts the range at 20% to 30%. In India, the right number depends on your loan rate, city, product type and how fast you sell.
Here are rough starting points based on how each category behaves. Treat them as guidance, not statistics.
- Fast-moving FMCG and staples: usually toward the lower end, since stock turns quickly
- Fashion and seasonal goods: often higher, because of markdowns and obsolescence
- Pharma and perishables: often higher, because of expiry and cold storage
- Auto parts and spares: often higher, because many items move slowly
- Electronics: higher risk from model changes and price drops
Your own trend matters more than any benchmark. Calculate your percentage every quarter and track it next to your inventory turnover ratio. When turnover rises, stock stays for fewer days, and carrying cost usually falls.
How to Reduce Inventory Carrying Cost: 8 Practical Ways
You do not need to cut everything. You need to cut the right things. Start here.
- 1. Prioritise with ABC analysis
A small share of SKUs usually drives most of your sales. Use ABC analysis to split items into A, B and C classes. Keep tight control on A items. Hold lean stock of C items. This one step often shows where the money is trapped.
- 2. Order the right quantity
Ordering too much raises carrying cost. Ordering too little raises ordering cost. The economic order quantity (EOQ) formula finds the balance. Note that carrying cost is a direct input, so a more accurate percentage gives you a better EOQ.
- 3. Set safety stock with data
Safety stock protects you from stockouts, but it also adds to holding cost. Many businesses set it by gut feeling and keep a thick cushion “just in case.” Use real demand and lead-time data instead. Our safety stock formula guide shows four ways to calculate it. Pair it with a sound reorder point so you reorder at the right moment, not too early.
- 4. Lift your inventory turnover
Faster turnover means less cash sitting on shelves. Review slow movers monthly. Bundle them, discount them or stop reordering them.
- 5. Clear dead and slow stock early
The longer stock ages, the less it is worth. Set an ageing rule, for example 90 days with no movement triggers a review. Then liquidate through discounts, bundles, B2B buyers or marketplace clearance sales. A small loss now beats a big write-off later.
- 6. Work with your suppliers
Ask for smaller, more frequent deliveries. Negotiate shorter lead times. Where possible, use consignment or vendor-managed stock for slow items. Reliable suppliers let you hold less buffer.
- 7. Use your space better
Space you pay for but do not use is pure waste. Store fast movers near dispatch. Use vertical racking. Consolidate half-empty zones. If you can shrink your footprint, rent savings often beat everything else on this list.
- 8. Get real-time visibility
You cannot reduce what you cannot see. Spreadsheets lag behind reality, so duplicate orders and phantom stock creep in. A warehouse management system shows live stock, ageing and expiry by location, which supports every tip above.
Inventory Carrying Cost Calculator: Build Yours in Excel or Google Sheets
You can build a working calculator in about ten minutes. Open a new sheet and set it up like this.
| Cell | Label | Example value / formula |
|---|---|---|
| B2 | Average inventory value | 5000000 |
| B3 | Capital cost rate | 12% |
| B4 | Capital cost | =B2*B3 |
| B5 | Annual storage cost | 480000 |
| B6 | Annual service cost | 80000 |
| B7 | Risk cost rate | 4% |
| B8 | Risk cost | =B2*B7 |
| B9 | Total carrying cost | =B4+B5+B6+B8 |
| B10 | Carrying cost % | =B9/B2 |
| B11 | Cost per day | =B9/365 |
Format B10 as a percentage. Now change one input at a time and watch the result move. Try raising your interest rate by one point. Try cutting average stock by 20%.
A few tips:
- Use monthly averages if your demand is seasonal
- Run the sheet separately for each warehouse
- Add a column for SKU-level cost per unit once the basics work
- Refresh the numbers every quarter
Don’t Cut Too Far: The Stockout Trade-Off
Lower carrying cost is good. Empty shelves are not. If a best-seller runs out during a festive week, the lost sale and the unhappy customer cost more than months of storage.
So think in terms of total inventory cost, which is carrying cost plus ordering cost plus stockout cost. The goal is the lowest total, not the lowest single number. That is exactly what EOQ, safety stock and reorder points are built to balance.
How a WMS Helps Cut Carrying Cost
A warehouse management system (WMS) will not lower your rent or interest rate. It does attack the parts you control.
- Live stock visibility across rooms, racks and warehouses
- Ageing and expiry alerts so slow items get action before they die
- Batch and FEFO control for food, FMCG and pharma
- Accurate counts, which reduce shrinkage and false reorders
- Smarter replenishment based on actual demand, not guesses
- Better space use through location and slotting rules
Wondering if it pays off? Our guide to WMS ROI and TCO in India walks through the savings and payback with a calculator.
Conclusion
Carrying cost is the price of waiting. Every rupee of stock that sits idle costs you capital, space, service and risk, often more than 25% a year.
Here is the quick recap:
- Use Carrying cost % = Total annual carrying cost ÷ Average inventory value × 100
- Count all four components: capital, storage, service and risk
- In India, watch interest rates, rent, GST on write-offs and festive overstock
- Cut it with ABC analysis, EOQ, smart safety stock, faster turnover and early dead stock clearance
- Balance savings against stockouts
Your next step is simple. Calculate your own percentage this week, using the sheet above. Then pick the biggest leak and fix it first.
Want to see where your stock cost is hiding? Talk to the Omneelab team for a walkthrough of how a WMS gives you live visibility and lower carrying cost.
FAQs
In practice, yes. Both describe what it costs to keep unsold stock. Some sources use holding cost for the per-unit figure and carrying cost for the full annual total. Both include capital, storage, service and risk costs.
A common global range is 20% to 30% of average inventory value. In India, it depends on your borrowing rate, city rent and product type. Fast-moving goods sit lower. Perishables, fashion and slow-moving spares sit higher. Track your own trend each quarter.
Capital cost is usually the largest component, so interest rates matter a lot. When the repo rate rises, floating-rate business loans can become more expensive, and your carrying cost rises with them. Holding less stock reduces your exposure.
Indirectly, yes. Input tax credit is generally not allowed on goods that are lost, stolen, destroyed or written off, and credit already taken may need to be reversed. This raises the real cost of dead and damaged stock. Check with your CA for your case.
Stock up using last year’s sales data, not hope. Limit deep buys on slow SKUs. Plan clearance for leftovers before the season ends. Watch marketplace storage fees and ageing charges. Real-time stock sync across channels also prevents overselling and overstocking.

Kapil Pathak is a Senior Digital Marketing Executive with over six years of experience specializing in the logistics and supply chain industry. His expertise spans digital strategy, search engine optimization (SEO), search engine marketing (SEM), and multi-channel campaign management. He has a proven track record of developing initiatives that increase brand visibility, generate qualified leads, and drive growth for D2C & B2B technology companies.