If you manage inventory, you have probably faced a familiar question: How much should we order at one time?
Order too little, and you may run out of stock before the next shipment arrives. Order too much, and your money gets tied up in inventory that may sit in the warehouse for weeks or even months.
This is where Economic Order Quantity (EOQ) can help. EOQ provides a way to determine an efficient order quantity by balancing two important inventory costs: ordering costs and holding costs.
But there is an important distinction. EOQ tells you how much to order. It does not tell you when to order or how much safety stock to keep.
In this guide, we will explain the economic order quantity formula, show you how to calculate EOQ with a practical example, and explain how EOQ works with safety stock and reorder points.
What Is Economic Order Quantity (EOQ)?
Economic Order Quantity (EOQ) is the optimal quantity of inventory a business should order at one time to minimize the combined cost of ordering and holding inventory.
Think about a distributor that needs 12,000 units of a product every year. It could place small orders every week, which would keep average inventory lower but increase the number of purchase orders. Or it could buy several thousand units at once, which would reduce ordering frequency but increase storage and carrying costs.
EOQ aims to find a practical balance between these two extremes. This makes it useful for purchasing, supply chain, warehouse, and inventory management decisions.
For a broader look at the problems businesses face while managing stock, see Omneelab’s guide to inventory management challenges and solutions.
Why Is Economic Order Quantity Important?
The cost of inventory is not limited to what you pay your supplier. Every purchase order can involve processing, communication, receiving, inspection, transportation coordination, and administrative work.
At the same time, inventory sitting in your warehouse creates its own costs. Storage space, handling, insurance, financing, damage, expiry, and obsolescence can all contribute to inventory holding costs.
This creates a simple trade-off. Ordering very frequently can increase ordering costs, while placing very large orders can increase holding costs. Economic order quantity helps identify an order size that balances these competing costs.
Economic Order Quantity Formula
The standard economic order quantity formula is:
EOQ = √(2DS / H)
Where:
- D = Annual demand in units
- S = Ordering cost per order
- H = Annual holding cost per unit
- EOQ = Economic Order Quantity
The formula may look technical at first, but each variable represents something you already work with in inventory management.
D = Annual Demand
D represents the total number of units the business expects to sell or use during a year. For example, if a company expects to sell 12,000 units of a product annually, its annual demand is 12,000 units.
S = Ordering Cost
S is the cost associated with placing and receiving one order. Depending on the business, this can include purchase order processing, supplier communication, receiving, inspection, transportation coordination, and administrative costs.
For example, if the company estimates that each purchase order costs ₹500 to process and receive, its ordering cost is ₹500 per order.
H = Holding Cost
H represents the annual cost of holding one unit in inventory. It can include warehouse storage, insurance, handling, financing, damage, expiry, obsolescence, and shrinkage.
For example, if holding one unit costs the company ₹20 per year, H is ₹20.
How to Calculate EOQ Step by Step
Let’s make the calculation practical.
Suppose a distributor sells 12,000 units of a product every year. The company estimates that its ordering cost is ₹500 per order, while its annual holding cost is ₹20 per unit.
Now apply the economic order quantity formula:
EOQ = √(2 × 12,000 × 500 / 20)
First, multiply annual demand by ordering cost and 2:
2 × 12,000 × 500 = 12,000,000
Next, divide the result by the annual holding cost:
12,000,000 / 20 = 600,000
Finally, take the square root:
√600,000 ≈ 775 units
So, the calculated EOQ is approximately 775 units per order.
This gives the business a useful benchmark for determining its order size. However, the purchasing team should not automatically order exactly 775 units every time. Supplier pack sizes, minimum order quantities, quantity discounts, seasonal demand, and other business constraints may require an adjustment.
In other words, EOQ is best treated as a planning baseline, not a fixed rule.
What Does the EOQ Calculation Tell You?
The main question answered by EOQ is straightforward:
How much should we order?
It does not directly tell you when to place the order, how much safety stock to maintain, or what to do when demand and supplier lead times become unpredictable.
Those decisions require additional inventory planning methods. This is where safety stock and reorder point calculations become important.
EOQ and Ordering Costs
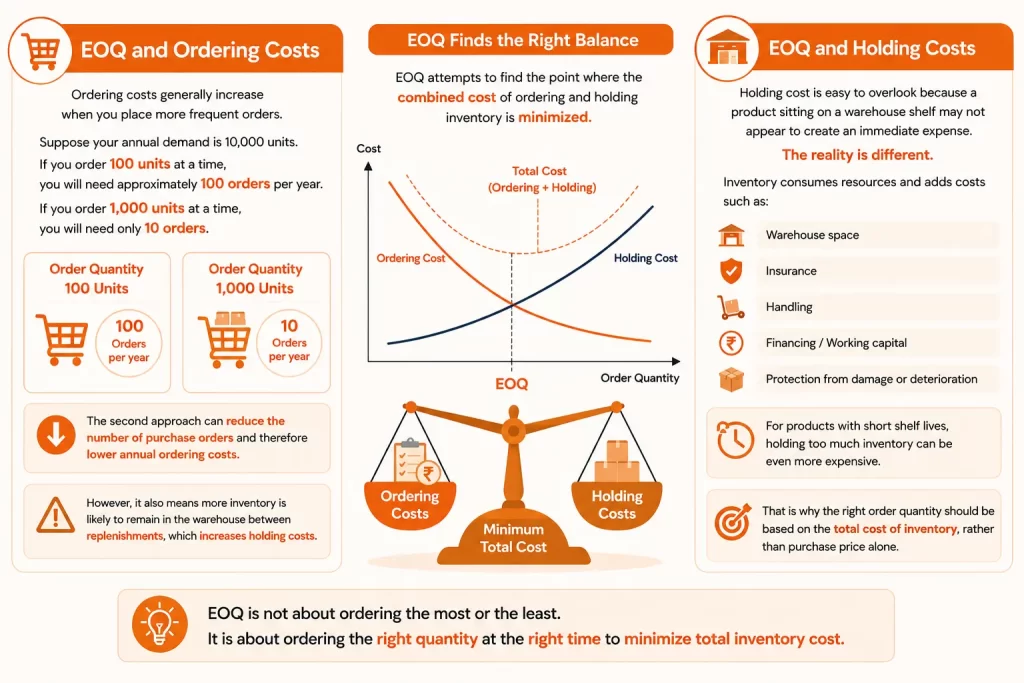
Ordering costs generally increase when you place more frequent orders.
Suppose your annual demand is 10,000 units. If you order 100 units at a time, you will need approximately 100 orders per year. If you order 1,000 units at a time, you will need only 10 orders.
The second approach can reduce the number of purchase orders and therefore lower annual ordering costs. However, it also means more inventory is likely to remain in the warehouse between replenishments.
That additional inventory increases holding costs. EOQ attempts to find the point where the combined cost of ordering and holding inventory is minimized.
EOQ and Holding Costs
Holding cost is easy to overlook because a product sitting on a warehouse shelf may not appear to create an immediate expense. The reality is different.
Inventory consumes warehouse space and working capital. It may also require insurance, handling, financing, and additional protection from damage or deterioration.
For products with short shelf lives, holding too much inventory can be even more expensive. A pharmaceutical distributor, for example, may need to balance replenishment efficiency with expiry risk.
That is why the right order quantity should be based on the total cost of inventory, rather than purchase price alone.
For more information about inventory-related costs and operational challenges, see Omneelab’s inventory management challenges and solutions.
EOQ Calculation Example
Let’s continue with our example:
- Annual demand = 12,000 units
- Ordering cost = ₹500 per order
- Holding cost = ₹20 per unit per year
- EOQ ≈ 775 units
Number of Orders Per Year
The approximate number of orders can be calculated by dividing annual demand by EOQ:
12,000 / 775 ≈ 15.5 orders
So, under this simplified model, the business would place approximately 15 to 16 orders per year.
Average Cycle Inventory
Under the basic EOQ model, average cycle inventory is approximately half of the order quantity:
Average Cycle Inventory = EOQ / 2
Therefore:
775 / 2 = 387.5 units
The business would have an average cycle inventory of approximately 388 units, before considering safety stock.
This is an important distinction because EOQ and safety stock serve different purposes.
What Is Safety Stock?
Safety stock is extra inventory held as a buffer against uncertainty.
Why is it necessary? Because actual demand and supply rarely follow forecasts perfectly. Customers may order more than expected, suppliers may deliver late, or transportation delays may extend lead times.
For example, imagine that your warehouse normally sells 100 units per day. If a supplier takes longer than expected to replenish your stock, those additional days can quickly create a shortage.
Safety stock gives the business an additional buffer to reduce the risk of stockouts.
For a detailed explanation of safety stock formulas, methods, and examples, read Omneelab’s Safety Stock Formula & Calculation Guide.
You can also explore Omneelab’s guide on buffer stock, including how to calculate and optimize it.
EOQ vs Safety Stock: What’s the Difference?
EOQ and safety stock are related, but they answer different inventory questions.
| Inventory Concept | Main Question |
|---|---|
| EOQ | How much should I order? |
| Safety Stock | How much extra inventory should I keep? |
| Reorder Point | When should I place the next order? |
A simple way to think about this is to imagine planning a road trip.
EOQ is the amount of fuel you decide to purchase each time you refuel. Safety stock is the extra fuel you keep available in case the journey takes longer than expected. Reorder point is the point at which you decide it is time to refuel.
Together, these concepts help businesses build a more complete inventory replenishment strategy.
Does Safety Stock Affect EOQ?
Not directly in the classical EOQ formula.
The standard economic order quantity formula considers annual demand, ordering cost, and holding cost. Safety stock addresses a different problem: uncertainty in demand and supply.
For example, EOQ may tell you that ordering 775 units is economical. However, the business may still need 100 additional units as safety stock because customer demand or supplier lead times are unpredictable.
Therefore, EOQ and safety stock should generally be treated as complementary inventory-management concepts.
For a detailed explanation of safety stock calculations, see Omneelab’s Safety Stock Formula & Calculation Guide.
What Is Reorder Point?
The reorder point (ROP) tells you when to place a replenishment order.
A simple reorder point formula is:
Reorder Point = Demand During Lead Time + Safety Stock
Suppose a product has average daily demand of 50 units, a supplier lead time of six days, and 100 units of safety stock.
Demand during lead time would be:
50 × 6 = 300 units
Therefore:
Reorder Point = 300 + 100 = 400 units
When available inventory reaches approximately 400 units, the business may trigger a replenishment order.
The exact method can vary depending on demand patterns, supplier reliability, lead-time variability, service-level targets, and inventory policies.
For a detailed explanation of reorder points and their calculation, see Omneelab’s Reorder Point: Definition, Formula & Importance.
EOQ vs Reorder Point
EOQ and reorder point are often confused because both are part of inventory replenishment. However, they solve different problems.
EOQ answers: How much should I order?
Reorder Point answers: When should I order?
For example, a business may have an EOQ of 775 units and a reorder point of 400 units. When inventory reaches 400 units, the business may place an order for approximately 775 units.
The basic replenishment cycle is therefore:
Inventory falls → Reorder point reached → Order triggered → EOQ quantity ordered → Inventory replenished
In a real warehouse, the system may also consider stock already on order, reserved inventory, supplier lead time, minimum order quantities, and other business rules.
For more information, read Omneelab’s guide to inventory replenishment methods.
How EOQ, Safety Stock and Reorder Point Work Together
Now let’s connect all three concepts with a practical example.
Imagine a warehouse selling a fast-moving SKU. The business calculates an EOQ of 775 units, maintains 100 units of safety stock, and has a reorder point of 400 units.
As customers place orders, inventory gradually falls from 1,000 units to 800, then 600, and eventually 400 units. Once the inventory reaches the reorder point, the replenishment process is triggered.
The business then orders approximately 775 units. While waiting for the supplier, inventory continues to fall, but the safety stock provides an additional buffer against unexpected demand or delays.
Once the new shipment arrives, inventory increases again and the cycle continues.
For a deeper understanding of how lead time influences inventory planning, see Omneelab’s Lead Time in Inventory Management Guide.
How to Calculate Safety Stock
There is no single safety stock formula that works for every business. The right method depends on factors such as demand variability, lead-time variability, service-level targets, historical sales data, and supplier reliability.
A simple approach is:
Safety Stock = Average Daily Demand × Number of Buffer Days
For example, if average daily demand is 100 units and the business wants three days of additional buffer:
Safety Stock = 100 × 3 = 300 units
This approach is easy to understand, but it may not be suitable for every business. Companies with reliable historical data can use more advanced methods involving standard deviation, Z-scores, demand variability, lead-time variability, and service levels.
For the formulas and worked examples, see Omneelab’s Safety Stock Formula & Calculation Guide.
EOQ Assumptions
The traditional EOQ model works best when several business conditions are reasonably stable.
Common assumptions include:
- Demand is relatively constant.
- Annual demand is known or can be estimated.
- Ordering cost remains relatively stable.
- Holding cost remains relatively stable.
- Lead time is known.
- Replenishment is predictable.
- Stockouts are not expected in the basic model.
- Quantity discounts are not included in the classical model.
- Inventory is replenished in a predictable manner.
Real businesses rarely meet every assumption perfectly. Demand changes, suppliers experience delays, and purchasing costs can fluctuate.
That does not make EOQ useless. It simply means EOQ should be treated as a planning model rather than an unquestionable answer.
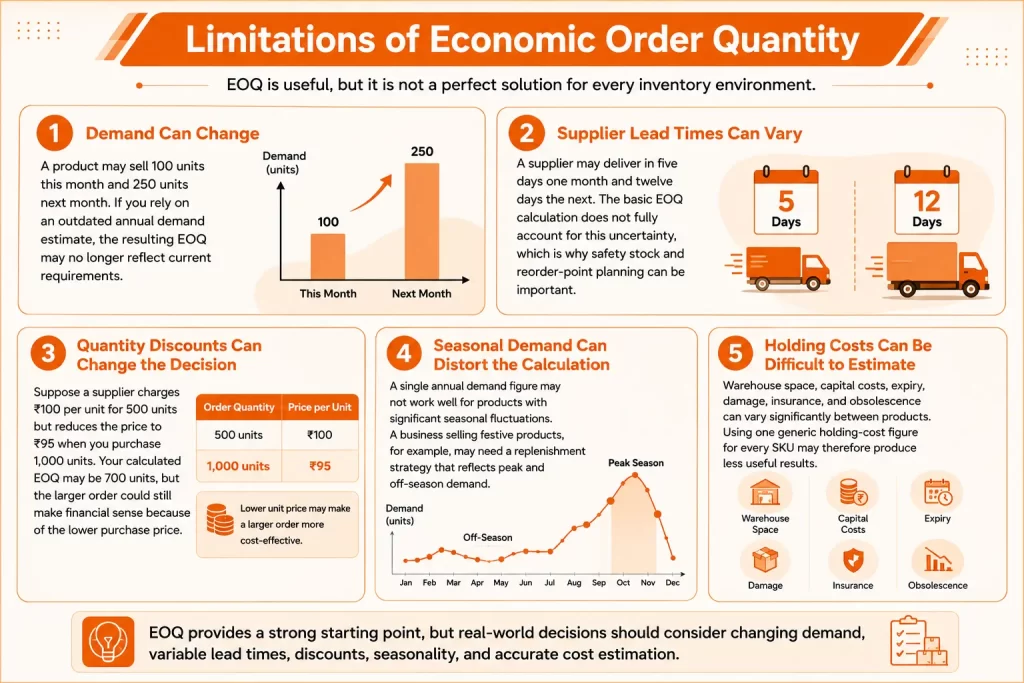
Limitations of Economic Order Quantity
EOQ is useful, but it is not a perfect solution for every inventory environment.
1. Demand Can Change
A product may sell 100 units this month and 250 units next month. If you rely on an outdated annual demand estimate, the resulting EOQ may no longer reflect current requirements.
2. Supplier Lead Times Can Vary
A supplier may deliver in five days one month and twelve days the next. The basic EOQ calculation does not fully account for this uncertainty, which is why safety stock and reorder-point planning can be important.
3. Quantity Discounts Can Change the Decision
Suppose a supplier charges ₹100 per unit for 500 units but reduces the price to ₹95 when you purchase 1,000 units. Your calculated EOQ may be 700 units, but the larger order could still make financial sense because of the lower purchase price.
4. Seasonal Demand Can Distort the Calculation
A single annual demand figure may not work well for products with significant seasonal fluctuations. A business selling festive products, for example, may need a replenishment strategy that reflects peak and off-season demand.
5. Holding Costs Can Be Difficult to Estimate
Warehouse space, capital costs, expiry, damage, insurance, and obsolescence can vary significantly between products. Using one generic holding-cost figure for every SKU may therefore produce less useful results.
For more practical inventory-management insights, see Omneelab’s Inventory Management Challenges and Solutions.
When Should You Use EOQ?
EOQ can be useful when demand is reasonably predictable and ordering and holding costs can be estimated with some confidence.
It is particularly helpful when a business has recurring inventory requirements and wants a consistent starting point for replenishment planning. It can also be useful when managing many SKUs and trying to reduce unnecessary ordering frequency without allowing inventory levels to grow excessively.
However, EOQ becomes more valuable when combined with other inventory-management methods, including demand forecasting, safety stock, reorder points, SKU segmentation, and real-time inventory visibility.
For a practical look at different replenishment approaches, see Omneelab’s complete guide to inventory replenishment.
EOQ in Warehouse Management
Now consider a warehouse managing 5,000 SKUs.
Your team may need to monitor current stock, average demand, supplier lead times, open purchase orders, safety stock, reorder points, stockouts, excess inventory, ordering costs, and holding costs.
Trying to manage all of this manually in spreadsheets can quickly become difficult. As the number of SKUs and warehouse locations grows, keeping inventory data accurate and up to date becomes even more challenging.
A Warehouse Management System (WMS) can centralize inventory information and give teams better visibility into stock movement and warehouse operations.
Omneelab’s AI-powered Warehouse Management System is designed to support warehouse operations, inventory visibility, and fulfillment processes.
If you’re still managing inventory manually, you can also read 12 Inventory Management Challenges and How to Solve Them to identify common warning signs.
EOQ for Multiple SKUs
EOQ becomes particularly useful when a business manages a large product catalog. However, applying the same assumptions to every SKU can lead to poor inventory decisions.
Different products can have different demand rates, ordering costs, holding costs, supplier lead times, safety-stock requirements, and service-level targets.
A fast-moving SKU may need a completely different replenishment strategy from a slow-moving product. That’s why EOQ is often more useful when calculated at the SKU level using accurate demand and inventory data.
ABC analysis can provide another layer of inventory prioritization by helping businesses classify products according to their value and importance. See Omneelab’s ABC Analysis in Inventory Management for more information.
Common EOQ Mistakes to Avoid
Mistake 1: Confusing EOQ With Reorder Point
EOQ and reorder point are not interchangeable. EOQ determines how much to order, while the reorder point determines when to place the order.
Mistake 2: Treating Safety Stock as EOQ
Safety stock is an additional inventory buffer designed to protect against uncertainty. It is not simply an extra part of the EOQ calculation.
Mistake 3: Using Outdated Demand Data
If annual demand has changed significantly, your EOQ may no longer represent current business conditions. Review the data regularly rather than relying on an old calculation.
Mistake 4: Ignoring Holding Costs
Warehouse rent is only one part of holding inventory. Capital, insurance, handling, expiry, damage, and obsolescence can also contribute to the real cost.
Mistake 5: Following EOQ Blindly
EOQ does not account for every real-world constraint. Supplier pack sizes, minimum order quantities, quantity discounts, seasonal demand, and operational requirements may require you to adjust the calculated quantity.
EOQ vs MOQ: Are They the Same?
No. EOQ and MOQ serve different purposes.
EOQ, or Economic Order Quantity, is the calculated order quantity that aims to balance ordering and holding costs. MOQ, or Minimum Order Quantity, is the smallest quantity a supplier is willing to sell.
For example, your calculated EOQ may be 700 units while your supplier’s MOQ is 1,000 units. In that situation, you cannot simply order 700 units because the supplier requires a minimum purchase of 1,000 units.
This is a good reminder that inventory formulas should support business decisions, not replace them.
EOQ vs Economic Production Quantity
EOQ is generally associated with purchasing and inventory replenishment. But what if you manufacture the product internally? That is where Economic Production Quantity (EPQ) can be more appropriate.
While EOQ generally assumes inventory arrives through a replenishment order, EPQ considers a production process where inventory builds gradually as products are manufactured. This makes EPQ more suitable for businesses that produce goods internally rather than purchase finished products from suppliers.
The two models answer slightly different questions:
- EOQ: How much should we purchase at a time?
- EPQ: How much should we produce in each production run?
The right model ultimately depends on how inventory enters your operation.
How Technology Can Improve EOQ-Based Inventory Planning
EOQ works well as a mathematical baseline, but modern inventory operations involve much more information than annual demand, ordering cost, and holding cost.
A business may need to consider real-time inventory levels, SKU demand, supplier lead times, open purchase orders, sales trends, seasonality, safety stock, reorder points, multiple warehouses, stock transfers, and supplier performance.
When this information is available in one system, inventory teams can make replenishment decisions faster and with less manual work.
Modern warehouse technology can also help connect inventory visibility with replenishment and operational processes. Omneelab’s AI in Warehouse Management guide explores how AI can support demand forecasting, inventory optimization, safety stock, and reorder-point decisions.
The goal is not simply to hold less inventory. The goal is to hold the right inventory, at the right time, in the right location, while controlling costs and protecting customer service levels.
Frequently Asked Questions About Economic Order Quantity
Economic Order Quantity is the optimal quantity of inventory to order at one time based on the balance between ordering costs and holding costs. The classical EOQ model is most useful when demand and other key inputs are reasonably stable.
The standard EOQ formula is EOQ = √(2DS/H). D represents annual demand, S represents ordering cost per order, and H represents annual holding cost per unit. The formula estimates an order quantity that balances ordering and holding costs.
EOQ determines how much inventory to order, while safety stock determines how much additional inventory to keep as a buffer against demand and supply uncertainty. For detailed formulas and examples, see Omneelab’s Safety Stock Formula & Calculation Guide.
EOQ answers how much to order, while the reorder point answers when to place the order. Businesses can use EOQ, reorder point, and safety stock together to create a more complete inventory replenishment strategy. See Omneelab’s Reorder Point Formula Guide for the detailed calculation.
EOQ can help reduce the combined cost of ordering and holding inventory when its assumptions reasonably match actual business conditions. However, purchasing decisions may also need to consider supplier MOQs, quantity discounts, seasonal demand, lead times, and other operational constraints.
Final Thoughts
Economic Order Quantity may look like a simple formula, but it addresses a problem almost every inventory team faces: How do we order enough stock without ordering too much?
The basic EOQ model balances two competing costs, ordering cost and holding cost. However, effective inventory management goes beyond the EOQ calculation itself.
EOQ tells you how much to order. Safety stock protects against uncertainty. Reorder point tells you when to reorder.
Together, these concepts provide a practical foundation for inventory replenishment and inventory optimization. When you combine them with accurate demand data, supplier lead times, SKU-level visibility, and automated inventory processes, replenishment decisions become more consistent and easier to manage.
For a broader understanding of replenishment strategies, explore Omneelab’s complete guide to inventory replenishment.
If your warehouse still relies heavily on spreadsheets and manual stock checks, explore Omneelab’s AI-powered Warehouse Management System to learn how centralized inventory and warehouse management can support better operational visibility.

Kapil Pathak is a Senior Digital Marketing Executive with over six years of experience specializing in the logistics and supply chain industry. His expertise spans digital strategy, search engine optimization (SEO), search engine marketing (SEM), and multi-channel campaign management. He has a proven track record of developing initiatives that increase brand visibility, generate qualified leads, and drive growth for D2C & B2B technology companies.