Here is a situation every inventory manager knows too well. Your bestselling SKU is flying off the shelves, your supplier promised delivery in eight days, and on day eleven the truck still has not arrived. Orders keep coming in. Stock keeps dropping. And then it happens: zero units on hand, customers switching to competitors, and marketplace listings slipping down the rankings.
Safety stock exists to make sure that story ends differently.
In this guide, we will cover what safety stock means, how to calculate safety stock using four different formulas with worked examples, how it differs from buffer stock, how it connects to your reorder point, and how a WMS keeps the whole thing running on autopilot. Whether you sell on Flipkart, run a D2C brand, or manage a 3PL warehouse, this is the math that keeps you in stock without drowning in excess inventory.
Let’s start with the basics.
What is Safety Stock? Meaning and Definition
Safety stock is the extra inventory you hold beyond expected demand to protect against unexpected supply delays and sudden demand spikes.
Think of it as an insurance policy in physical form. You do not expect to need it, but when a supplier goes quiet for two weeks or a product goes viral overnight, that extra stock is the only thing standing between you and a stockout.
Here is a simple safety stock example. Say you sell 200 water bottles a day and your supplier takes 8 days to deliver. In a perfect world, you would reorder exactly 1,600 units every cycle and never hold a unit more. But the world is not perfect. Demand jumps to 260 on some days. Deliveries take 12 days sometimes. Safety stock covers the gap between “expected” and “actual.”
A few things safety stock is not:
- It is not your regular cycle stock, which is the inventory you sell through between replenishments.
- It is not dead weight. It is a calculated reserve with a specific job.
- It is not a fixed rule of thumb like “keep 20% extra.” Good safety stock levels come from formulas, not guesses.
Why Safety Stock Matters: The Cost of Running Out
Why bother with the math at all? Because stockouts are far more expensive than they look.
When you run out of stock, you lose more than the immediate sale. You lose marketplace ranking, because platforms like Amazon and Flipkart penalize out-of-stock listings. You lose customers, because shoppers who buy from a competitor once often do not come back. And you lose ad spend, because traffic keeps landing on a listing that cannot convert.
Stockout prevention is the core purpose of safety stock. The flip side is the carrying cost trade-off: every extra unit you hold ties up cash, occupies warehouse space, and risks becoming obsolete. The goal is not maximum safety stock. It is optimal safety stock, and that is exactly what the formulas below help you find.
Safety Stock vs Buffer Stock: What is the Difference?
People use these terms interchangeably, and for small operations that is usually fine. But in formal inventory management, safety stock and buffer stock protect against different kinds of uncertainty.
Safety stock protects against the unexpected. Buffer stock protects against the expected.
| Safety Stock | Buffer Stock | |
|---|---|---|
| Protects against | Unknown risks: supplier delays, demand shocks | Known variations: seasonality, promotions |
| Trigger | Unpredictable events | Predictable, planned events |
| Sizing | Statistical formulas based on variability | Forecast-based, planned in advance |
| Behavior | Stays fairly constant as a reserve | Built up and drawn down in cycles |
| Example | Supplier truck stuck for 4 extra days | Extra stock built for Diwali demand |
So if you stock up ahead of the festive season because you know demand will triple, that is buffer stock. If you hold extra units year-round because your supplier’s lead time swings between 6 and 12 days, that is safety stock. Most businesses need both, and our detailed guide on buffer stock and how to calculate it covers the other half of this pair.
Two related terms worth knowing: cycle stock is your working inventory between replenishments, and anticipation inventory is stock built ahead of a known event, which overlaps heavily with buffer stock.
How to Calculate Safety Stock: 4 Formulas with Worked Examples
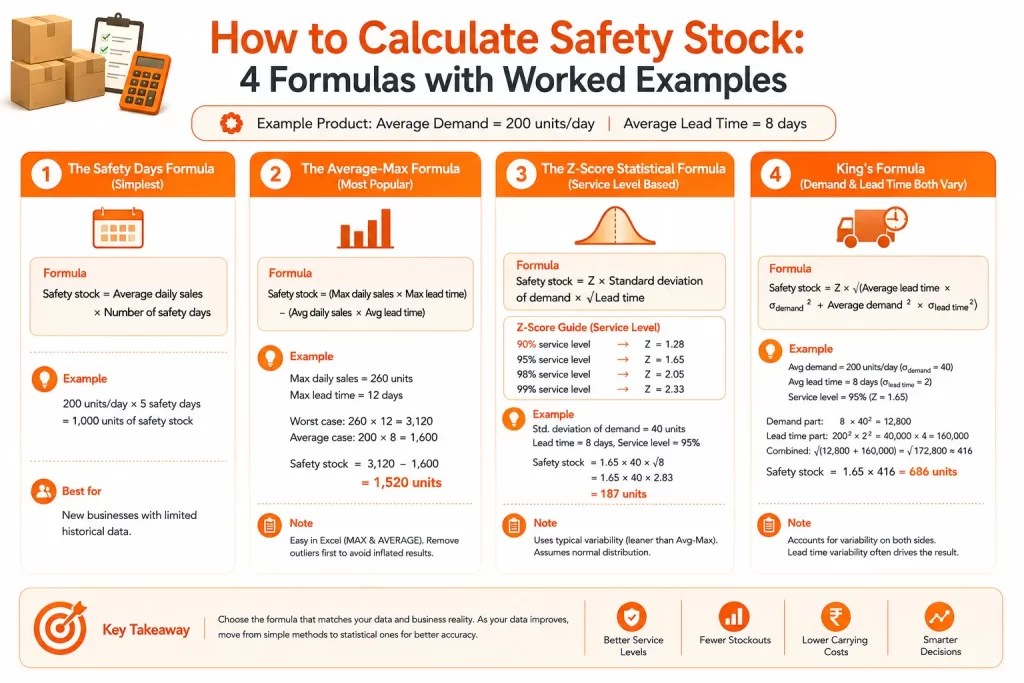
Now for the part you came for. There is no single safety stock formula. There are several, and the right one depends on how much data you have and how variable your demand and lead times are. We will use the same product throughout: average demand of 200 units per day, average lead time of 8 days.
- Method 1: The Safety Days Formula (Simplest)
Safety stock = average daily sales × number of safety days
You decide how many days of cover you want and multiply.
Example: 200 units per day × 5 safety days = 1,000 units of safety stock.
This method takes five minutes and zero statistics. However, the “safety days” number is a gut call, so it works best for new businesses that do not yet have enough sales history for anything smarter. - Method 2: The Average-Max Formula (Most Popular)
Safety stock = (maximum daily sales × maximum lead time) − (average daily sales × average lead time)
This method uses your worst-case numbers to size the cushion.
Example: Your maximum daily sales hit 260 units, and your worst lead time was 12 days.
– Worst case: 260 × 12 = 3,120
– Average case: 200 × 8 = 1,600
– Safety stock = 3,120 − 1,600 = 1,520 units
It is easy to build in Excel with MAX and AVERAGE functions on your sales and lead time data. The catch? One freak outlier day can inflate the result badly, so clean your data first. - Method 3: The Z-Score Statistical Formula (Service Level Based)
Safety stock = Z × standard deviation of demand × √lead time
This is where service level enters the picture. The Z-score converts your target service level, meaning the percentage of demand you want to fulfill without a stockout, into a multiplier:
– 90% service level → Z = 1.28
– 95% service level → Z = 1.65
– 98% service level → Z = 2.05
– 99% service level → Z = 2.33
Example: Your daily demand has a standard deviation of 40 units, lead time is 8 days, and you want 95% service.
Safety stock = 1.65 × 40 × √8
= 1.65 × 40 × 2.83
= 187 units
Notice how much leaner this is than the average-max result. That is because statistics measures typical variability instead of worst-case extremes. In Excel, STDEV.P on your daily sales column gives you the standard deviation, and SQRT handles the lead time.
One caveat: this formula assumes demand follows a normal distribution. For products with wild, spiky demand, treat the output as a starting point, not gospel. - Method 4: King’s Formula (Demand and Lead Time Both Vary)
What if your supplier is as unpredictable as your customers? King’s formula, published in a widely cited paper hosted by MIT, accounts for variability on both sides:
Safety stock = Z × √(average lead time × σ demand² + average demand² × σ lead time²)
Example: Demand averages 200 per day (standard deviation 40), lead time averages 8 days (standard deviation 2), and you want 95% service.
Demand part: 8 × 40² = 8 × 1,600 = 12,800
Lead time part: 200² × 2² = 40,000 × 4 = 160,000
Combined: √(12,800 + 160,000) = √172,800 ≈ 416
Safety stock = 1.65 × 416 = 686 units
Interesting, right? Lead time variability dominates the result. For most Indian businesses, the supplier side, not the customer side, is the bigger source of risk, and this formula makes that visible.
Which Safety Stock Formula Should You Use?
A quick decision guide:
- New business, thin data: safety days method.
- Stable lead times, variable demand: Z-score statistical formula.
- Variable lead times too: King’s formula.
- Want a quick sanity check: average-max formula.
Whichever you choose, recalculate at least quarterly. Demand patterns shift, suppliers change, and last year’s safety stock number quietly goes stale.
Safety Stock and Reorder Point: How They Work Together
Safety stock on its own does nothing. It only works when it is wired into your reorder point, which is the stock level that triggers a new purchase order.
Reorder point = (average daily demand × average lead time) + safety stock
Example: Using our numbers with King’s formula:
- ROP = (200 × 8) + 686 = 1,600 + 686 = 2,286 units
When stock hits 2,286, you reorder. The 1,600 covers expected demand during the lead time, and the 686 absorbs surprises. If everything goes to plan, the new shipment arrives just as you dip into safety stock territory.
We have a full breakdown of the reorder point formula and why it matters if you want to go deeper. Pair it with a sound replenishment strategy and stockouts become rare events instead of monthly fire drills.
How Much Safety Stock Should You Keep?
The honest answer: it depends on the SKU. Applying one service level across your entire catalog is a common and costly mistake.
A smarter approach uses ABC analysis:
- A items (top sellers, most revenue): aim high, 98-99% service level. A stockout here really hurts.
- B items (middle of the pack): 95% is usually enough.
- C items (slow movers): 90% or lower. Excess stock here just eats space and cash.
Remember the trade-off. Pushing service level from 95% to 99% does not increase safety stock by 4%. Because Z-scores climb steeply, it increases it by roughly 40%. That extra inventory drags down your inventory turnover ratio and ties up working capital. Choose your battles SKU by SKU.
Disadvantages of Holding Too Much Safety Stock
Safety stock is medicine, and like any medicine, overdosing causes problems:
- Higher carrying costs. Storage, insurance, and capital costs typically run 20-30% of inventory value per year.
- Hidden operational problems. Fat safety stock quietly covers up poor supplier performance, bad forecasting, and slow internal processes. The problems stay invisible until they get expensive.
- Obsolescence and expiry risk. Fashion goes out of season. FMCG products expire. Electronics get replaced by newer models. Aging excess stock also distorts your books, depending on which inventory valuation method (FIFO, LIFO, or weighted average) you follow.
- Space crunch. Every pallet of “just in case” stock is space your fast movers cannot use.
Therefore, treat rising safety stock as a signal. If the formula keeps demanding more cushion, the real fix might be a more reliable supplier or better demand-driven replenishment, not a bigger warehouse.
Can Safety Stock Be Zero?
Yes, and sometimes it should be. Zero safety stock makes sense when demand is perfectly predictable, when lead times are rock solid, or when the product is made to order. Some lean and just-in-time operations run near-zero safety stock by design, betting on extremely reliable suppliers.
For most product businesses in India, though, zero safety stock is a gamble. Monsoon transport delays, festive demand swings, and multi-day supplier variability are facts of life here. A calculated cushion beats a brave zero.
Safety Stock in India: Festive Spikes and Lead Time Reality
Indian inventory planning has two features that make safety stock math extra important.
First, festive season demand spikes. Diwali, Rakhi, and the wedding season can multiply daily demand several times over in a matter of days. Strictly speaking, the predictable part of that surge should be handled with buffer stock built in advance, which is why festive rush inventory planning deserves its own calendar. But the unpredictable part, like a surprise viral listing during a sale event, is safety stock’s job.
Second, lead time variability. Between long supplier distances, seasonal transport disruptions, and port or customs delays for imported goods, Indian lead times swing more than textbook examples assume. That is exactly the scenario King’s formula was built for, and it is why the lead time term dominated our worked example above.
How a WMS Automates Safety Stock Management
Here is the problem with spreadsheets: safety stock is not a set-and-forget number. Demand shifts, suppliers change, and a formula you calculated in January is misleading you by June. This is where an e-warehouse management system (eWMS) earns its keep.
A modern WMS handles the grunt work automatically:
- Real-time stock visibility. The system knows exact on-hand quantities across every location, so safety stock triggers fire on facts, not on last week’s spreadsheet.
- Automatic reorder alerts. When any SKU dips to its reorder point, the system flags it or raises a purchase requisition. No one has to remember to check.
- SKU-level service levels. Set 99% cover for A items and 90% for C items, and the system applies the right cushion to each.
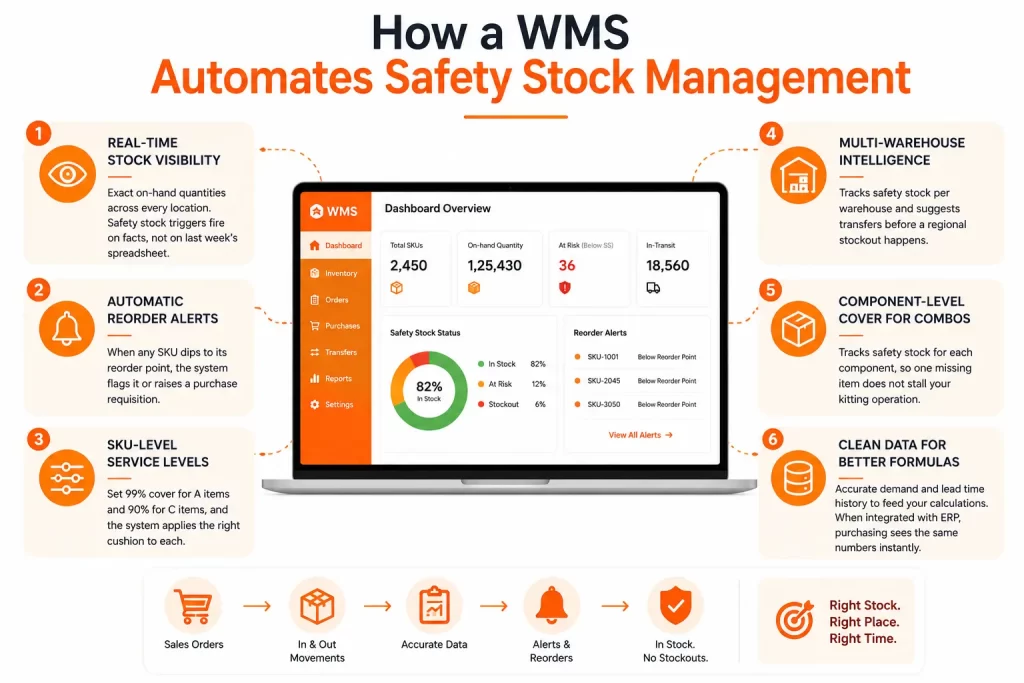
- Multi-warehouse intelligence. If you stock across multiple locations, the WMS tracks safety stock per warehouse and can suggest transfers before a regional stockout happens.
- Component-level cover for combos. If you sell gift sets or combo packs, the system tracks safety stock for each component, so one missing item does not stall your entire kitting operation.
- Clean data for better formulas. Every inbound and outbound movement is timestamped, giving you accurate demand and lead time history to feed your calculations. When your WMS is integrated with your ERP, purchasing sees the same numbers instantly.
Users of platforms like SAP know this as safety stock planning inside MRP. The same principle applies at any scale: let the system watch the levels so your team can work on exceptions instead of eyeballing stock counts.
Conclusion: Calculate It, Automate It, Review It
Let’s recap. Safety stock is the calculated extra inventory that protects you from supply delays and demand surprises. It differs from buffer stock, which handles predictable variations like festive seasons. You can calculate safety stock four ways: safety days for simplicity, average-max for quick worst-case cover, the Z-score formula for service level precision, and King’s formula when lead times are as shaky as demand. Wire the result into your reorder point, tune it by SKU with ABC analysis, and review it quarterly.
Most importantly, do not manage it by hand. Stock levels change by the minute, and the businesses that avoid stockouts are the ones whose systems watch inventory around the clock.
Want safety stock alerts that run themselves? Omneelab’s eWMS tracks stock in real time, fires reorder alerts at the SKU level, and keeps your inventory data clean enough to trust the math. Book a demo and stop discovering stockouts after they happen.
Frequently Asked Questions
They are close cousins but not identical. Minimum stock level is the lowest quantity you allow before action is taken, and it is usually set at or just above your safety stock. Safety stock is the statistically calculated reserve itself. In many systems, the minimum stock alert is simply set equal to the safety stock quantity.
Put daily sales in one column and use AVERAGE and MAX for the average-max method, or STDEV.P for the standard deviation needed in the Z-score formula. Then apply the formula in a cell, for example =1.65*STDEV.P(B2:B365)*SQRT(8) for 95% service with an 8-day lead time. An online safety stock calculator works too, but Excel lets you recalculate with fresh data anytime.
Service level is the probability of not hitting a stockout during a replenishment cycle. Fill rate is the percentage of customer demand you actually fulfill from stock on hand. A 95% service level does not mean you fulfill 95% of units; the two measure different things, and advanced formulas like King’s can target fill rate directly.
Economic order quantity (EOQ) tells you how much to order to minimize ordering plus carrying costs. Safety stock and reorder point tell you when to order. They work together: EOQ sets your order size, while the reorder point, which includes safety stock, sets the trigger. Neither replaces the other.
Anticipation stock (or anticipation inventory) is stock deliberately built ahead of a known future event, such as a festive sale, a planned promotion, or a factory. It is planned and temporary. Safety stock, in contrast, is a standing reserve against unknown risks. If you can see the event coming on a calendar, you need anticipation or buffer stock, not more safety stock.

Kapil Pathak is a Senior Digital Marketing Executive with over six years of experience specializing in the logistics and supply chain industry. His expertise spans digital strategy, search engine optimization (SEO), search engine marketing (SEM), and multi-channel campaign management. He has a proven track record of developing initiatives that increase brand visibility, generate qualified leads, and drive growth for D2C & B2B technology companies.