A warehouse manager in Bhiwandi once told me something that stuck. He knew the value of every pallet in his building, down to the rupee. But when I asked what one picker actually produced in a shift, he had to guess.
That gap is common. Indian warehouses track stock beautifully and track people barely at all. Yet people are usually the biggest line in the operating budget, ahead of rent and ahead of technology.
So this guide is about the other half of your warehouse. Not the racks, the workers. We will cover what warehouse labour productivity really means, how to calculate it, what good looks like, where your hours leak, and how a warehouse management system turns guesswork into something you can manage.
There are formulas ahead, but none need more than a calculator.
What Is Warehouse Labour Productivity?
Warehouse labour productivity is the useful work your team completes per hour of paid time. Output divided by effort. That is it.
Output can be picks, lines, cases, orders or pallets. Effort is measured in labour hours. Put them together and you get a number you can track and improve.
Why does the definition matter? Because when managers say “productivity is fine,” they usually mean orders went out on time. That is not productivity. That is effectiveness. You can ship everything on time while burning 40% more man-hours than you need.
Productivity vs Efficiency vs Utilisation
These three words get used interchangeably, and the confusion costs real money.
- Warehouse labour productivity: how much did we produce per hour? Say, 95 lines picked.
- Efficiency: how did we perform against the expected standard? 95 lines against a standard of 110 is 86%.
- Utilisation: how much paid time went into useful work at all? 6.4 productive hours in an 8 hour shift is 80%.
Each points somewhere different. Low productivity with high utilisation means your methods are slow. Low utilisation with high efficiency means your people are quick when they work, but they wait around too much.
That second case is far more common in India than operators expect, and it is much cheaper to fix. Good warehouse workforce management starts with knowing which of the three you are actually short on.
The Warehouse Labour Productivity Formula
Let us get practical. The core formula is refreshingly simple.
Labour Productivity = Total Output ÷ Total Labour Hours
Say your team picked 7,600 lines yesterday. Twelve pickers worked 8 hours each, giving 96 labour hours.
7,600 ÷ 96 = 79.2 lines per hour per person.
That is your baseline. Track it daily for a month and patterns appear that you never noticed: Monday dips, post-lunch slumps, the effect of a new layout.
The same formula works for any process.
| Metric | Formula | Best For |
|---|---|---|
| Lines per hour (LPH) | Lines picked ÷ labour hours | Outbound picking |
| Units per hour (UPH) | Units handled ÷ labour hours | Packing and sorting |
| Cases per hour | Cases moved ÷ labour hours | FMCG distribution |
| Receiving rate | Cartons received ÷ labour hours | Inbound docks |
| Putaway rate | Putaways ÷ labour hours | Storage teams |
One warning. Do not blend direct and indirect hours in the denominator without saying so. Direct labour is touch time on picks, packs and putaways. Indirect labour covers supervision, housekeeping and safety briefings. Mix them silently and nobody will trust the report.
Labour Cost Per Order: The Number Finance Cares About
Lines per hour excites operations people. It does nothing for the finance team. Translate it into rupees and everyone listens.
Labour Cost Per Order = Fully Loaded Labour Cost ÷ Orders Shipped
“Fully loaded” is doing heavy lifting there. In India it includes wages and allowances, Provident Fund and ESIC, bonus and gratuity accruals, manpower agency fees, overtime premium, training time and paid non-productive time.
Here is a worked example. Plug in your own figures as you read.
Your outbound team of 20 costs ₹22,000 per person per month once everything above is loaded in. That is ₹4,40,000. In that month you shipped 55,000 orders.
₹4,40,000 ÷ 55,000 = ₹8 labour cost per order.
Now lift warehouse labour productivity by 15%. You either ship the same volume with 17 people, or 63,000 orders with the same 20. Either way cost per order falls to roughly ₹7. Across a year, on rising volumes, that is serious money.
Warehouse Labour Productivity Benchmarks for Indian Warehouses
Everyone wants a warehouse labour productivity benchmark. Treat the table below as a starting frame, not a verdict.
Published figures skew towards US and European operations, where wages, automation and order profiles differ enormously from a manual pick face in Hosur or Bhiwadi. A picker handling 40 kg tyre cartons cannot be compared with someone picking lipstick.
| Operation Type | Typical Range (lines/hour) | What Shifts It |
|---|---|---|
| Manual piece picking, small items | 60 to 110 | Travel distance, SKU density |
| Manual piece picking, bulky goods | 25 to 50 | Item weight, equipment |
| Batch or cluster picking | 100 to 180 | Batch size, sortation |
| Case picking, FMCG | 80 to 150 | Pallet rules, dock congestion |
| Pharma with batch and expiry capture | 45 to 90 | Scan steps, compliance checks |
| Apparel with size and colour variants | 70 to 130 | Location accuracy, returns |
Three rules for using benchmarks sensibly:
- Compare yourself to yourself first. Your own 12 week trend beats any industry average.
- Segment before comparing. Blend fast and slow movers into one average and it means nothing.
- Pair speed with quality. A picker doing 140 lines at 96% accuracy costs more than one doing 100 lines at 99.9%, once you count returns and reships.
For the wider scorecard, see our warehouse KPIs and metrics dashboard guide.
Where Your Warehouse Hours Actually Disappear
Before pushing people to work faster, find where the time already goes. In most warehouses the workers are not the problem. The design around them is.
Here are the seven leaks that damage warehouse labour productivity most often.
1. Travel time. In manual picking, walking commonly eats half a shift. That is layout, not laziness. Poor slotting means walking 60 metres for a fast mover that belongs beside the dispatch lane.
2. Search time. Faded labels, missing location barcodes, stock one bay away from where the system says. Every search is a small tax paid hundreds of times a day.
3. Wave gaps. A picking wave ends, the next is not released, twelve people stand and chat for nine minutes. Repeat four times a shift and you have lost most of a man-day.
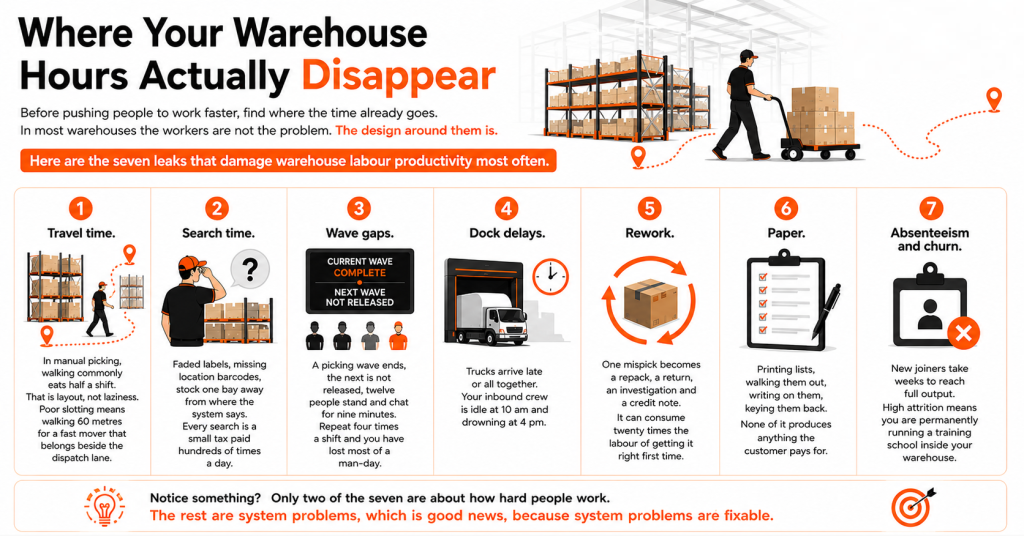
4. Dock delays. Trucks arrive late or all together. Your inbound crew is idle at 10 am and drowning at 4 pm.
5. Rework. One mispick becomes a repack, a return, an investigation and a credit note. It can consume twenty times the labour of getting it right first time.
6. Paper. Printing lists, walking them out, writing on them, keying them back. None of it produces anything the customer pays for.
7. Absenteeism and churn. New joiners take weeks to reach full output. High attrition means you are permanently running a training school inside your warehouse.
Notice something? Only two of the seven are about how hard people work. The rest are system problems, which is good news, because system problems are fixable.
WMS vs Labour Management System: What Is the Difference?
This comes up in almost every software evaluation, so let us settle it.
A Warehouse Management System (WMS) directs the work. It decides what gets picked, in what sequence, from which location, by whom.
A warehouse labour management system (LMS) measures the work. It compares what each person did against an expected standard and reports the gap.
| Aspect | WMS | LMS |
|---|---|---|
| Core purpose | Direct inventory and tasks | Measure human performance |
| Main output | Tasks, allocations, stock accuracy | Standards, reports, incentives |
| Typical user | Supervisor, operator, planner | Ops head, HR, finance |
| Data captured | Location, quantity, batch, timestamp | Time per task, percent of standard |
| Works standalone? | Yes | Rarely |
Here is the practical point. A labor management system cannot function without WMS data. It has nothing to measure. Meanwhile a modern WMS already timestamps every scan, so it holds most of what an LMS needs.
For very large multi-shift operations, a dedicated LMS earns its keep. For most Indian warehouses, however, the smarter first move is to use the labour data your WMS already collects. If you are still weighing the platform itself, start with our guide to the business need for a warehouse management system.
How a WMS Improves Warehouse Labour Productivity
So what actually moves the needle? These are the levers, roughly in order of impact.
Task Interleaving
Underrated, and often free. Task interleaving means the system hands a worker a second task on the return leg of the first.
Instead of a forklift operator putting away a pallet and driving back empty, the WMS spots a nearby replenishment pickup and assigns it. The empty trip becomes productive.
Think of a taxi driver picking up a fare on the way back to the stand. Same fuel, twice the revenue.
Smarter Slotting
If travel is your biggest leak, slotting is your biggest lever. Fast movers belong at waist height near dispatch. Slow movers can live upstairs.
A WMS recalculates this as demand shifts, which matters enormously for seasonal businesses. Our piece on warehouse slotting and storage optimisation breaks down the method.
Directed, Paperless Picking
Handheld scanners remove the print, walk, write, key cycle entirely. The device tells the picker where to go and confirms the scan on the spot.
Speed and accuracy improve together, so you stop paying for rework. See our paperless picking guide and the companion piece on warehouse barcode scanning.
Better Picking Methods
Single order picking is simple and slow. Batch, cluster and zone picking cut walking per line sharply, but they need a system to manage sortation. Our warehouse order picking guide compares the options.
Labour Forecasting and Workload Balancing
A WMS that sees the order book can tell you on Thursday how many people Saturday needs. Panic overtime becomes planned staffing.
Balancing goes further, spreading tasks so you do not have four people idle in aisle 3 while aisle 9 is buried. Increasingly, AI in warehouse management is being applied to exactly this problem.
Live Performance Visibility
When a supervisor sees output by person, zone and hour, coaching happens during the shift rather than after it.
Handle this carefully, though. A screen that only names the slowest worker breeds resentment. One that helps a supervisor spot a jammed conveyor at 11 am builds trust.
Warehouse Manpower Planning: How Many People Do You Need?
Most warehouses staff by memory. “Last Diwali we had 45 people, so take 45 again.”
There is a better way, and it takes five minutes. It only works, though, once you know your real warehouse labour productivity rate.
Step 1. Forecast volume. Say 6,000 lines tomorrow.
Step 2. Apply your real productivity rate, not your hoped-for one. Suppose 80 lines per hour. That is 75 productive hours needed.
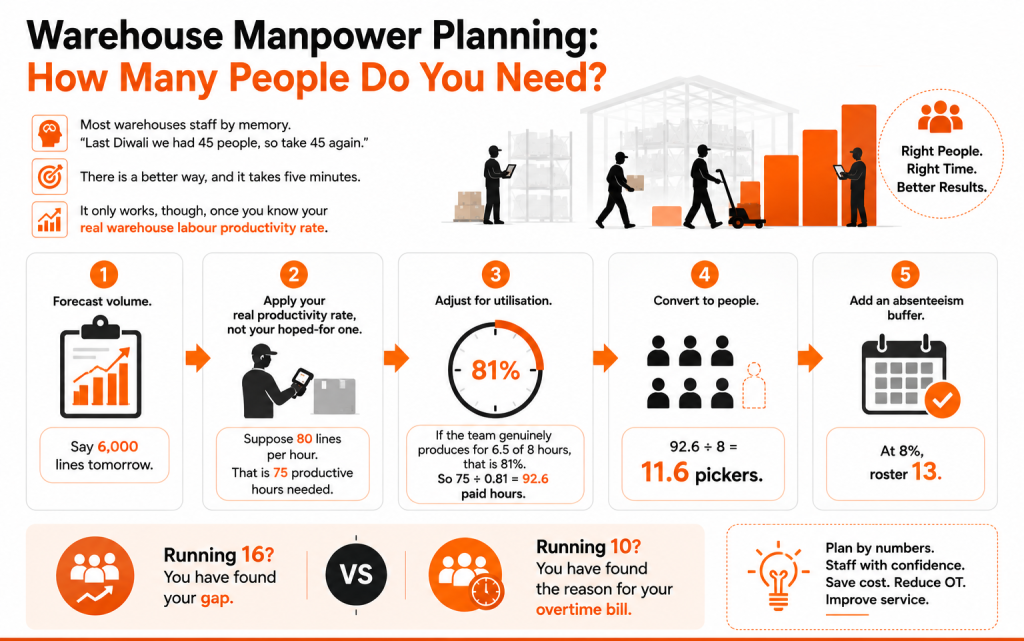
Step 3. Adjust for utilisation. If the team genuinely produces for 6.5 of 8 hours, that is 81%. So 75 ÷ 0.81 = 92.6 paid hours.
Step 4. Convert to people. 92.6 ÷ 8 = 11.6 pickers.
Step 5. Add an absenteeism buffer. At 8%, roster 13.
Now compare that with what you actually roster. Running 16? You have found your gap. Running 10? You have found the reason for your overtime bill.
Run this weekly and manpower planning stops being guesswork. Run it before peak and it becomes genuinely valuable. Our article on managing the festive rush with mobile WMS covers that cycle.
The India Layer: Contract Labour and the New Labour Codes
Everything above applies anywhere. This part does not.
Indian warehouses run largely on contract and fixed-term workers supplied through manpower vendors. That gives flexibility, but productivity data sits in one system while workforce data sits in another. Bridging the two is where visibility is lost.
There is also a compliance shift. India’s four labour codes took effect on 21 November 2025, consolidating 29 earlier central laws, with rules rolling out through 2026.
Two changes hit warehouse cost models directly:
- The wage definition rule. Where allowances exceed 50% of total remuneration, the excess counts as wages. That flows into PF, gratuity and bonus, raising fully loaded cost per worker.
- Pro-rata gratuity for fixed-term workers. The earlier five year threshold no longer applies the same way, which changes how you cost seasonal hiring.
You can check the official position via the Ministry of Labour and Employment and a clear professional summary in this KPMG briefing on the labour codes.
The takeaway is simple. If your fully loaded labour cost has moved, your cost per order has moved too. Do not run 2026 volumes against a 2024 cost assumption.
Incentive Schemes That Actually Work Here
Measuring warehouse labour productivity without motivating anyone goes stale fast. People stop caring about a number that changes nothing for them.
Three models are common, and each has a catch.
Per-piece rate. Drives volume hard, but quality collapses unless you gate payment on accuracy.
Pooled team bonus. Builds cooperation and stops fights over who got the easy aisle. However, strong performers can feel they are carrying others.
Tiered individual bonus. Pays a step up at defined productivity bands, with an accuracy gate. In my experience this lasts longest here, because it is transparent.
Whichever you choose, three ground rules apply:
- Publish the standard before the shift, never after.
- Make the calculation something a worker can verify on their own phone.
- Never set a standard that assumes zero breaks. Fatigue allowances are not optional.
Your 90 Day Plan
You do not need a transformation programme. You need a quarter.
Days 1 to 30: Measure honestly. Pull task timestamps from your WMS. Calculate warehouse labour productivity by process, shift and person. Work out your true fully loaded cost per order. Resist fixing anything yet.
Days 31 to 60: Find the leaks. Walk the floor at 9 am, 1 pm and 6 pm. Time the wave gaps. Map three pickers’ travel paths for an hour each. Compare top and bottom quartile performers and ask what is different, because it is rarely effort.
Days 61 to 90: Fix and standardise. Reslot your top 100 SKUs. Turn on task interleaving. Close the biggest wave gap. Write the new method into a documented procedure, using our guide to creating an inventory SOP. Then set your first standard and communicate it clearly.
By day 90 you will not have a perfect warehouse. But you will have a number, a trend, and a team that knows what good looks like.
Bringing It Together
Warehouse labour productivity is not about pushing people harder. It is about removing the friction that stops good people doing good work.
The essentials:
- Productivity is output per labour hour, and differs from efficiency and utilisation.
- Translate it into labour cost per order so finance engages with it.
- Benchmark against your own trend before the industry’s.
- Most lost hours come from travel, search, waiting and rework.
- A WMS lifts warehouse labour productivity through interleaving, slotting, paperless picking, forecasting and live visibility.
- In India, contract labour and the new codes change your cost base, so recalculate regularly.
Start with the data you already have. Your WMS has been quietly timestamping every scan for years.
Ready to see it in practice? Book a demo of Omneelab WMS and we will walk you through labour tracking, task allocation and productivity dashboards using your own operation as the example. Still comparing? Read our roundup of the best warehouse management software in India.
Frequently Asked Questions
Warehouse labour productivity measures how much work your team completes per hour of paid time. The formula is total output divided by total labour hours. Output can be lines, units, cases or orders, depending on the process. For example, 7,600 lines picked across 96 labour hours gives 79.2 lines per hour. Track it separately for receiving, putaway, picking, packing and returns, because one blended figure hides the process actually holding you back.
A warehouse management system directs work: it allocates tasks, sequences picks and controls inventory movement. A labor management system measures work, comparing each person’s output against engineered labour standards and reporting the percentage of standard achieved. An LMS depends on WMS task data, so it rarely runs alone. Because a modern WMS already timestamps every scan, most Indian warehouses can build useful labour reporting from their existing WMS before buying a separate LMS.
A WMS reduces manpower cost by removing wasted hours, not by cutting headcount arbitrarily. The main levers are task interleaving, which turns empty return trips productive, slotting optimisation, which cuts travel distance, paperless picking through mobile scanning, which removes rekeying and mispicks, and labour forecasting, which converts unplanned overtime into planned staffing. Together these raise utilisation and lower labour cost per order.
The causes are usually structural, not personal. Excessive travel time from poor slotting, search time from missing location labels, idle time during wave gaps, uneven dock scheduling, rework from picking errors, paper-based processes that add non-value-adding steps, and high absenteeism or attrition that keeps new joiners below full output. Fixing layout, task release and scanning lifts warehouse labour productivity more than any effort to make people work faster.
Start with forecast volume, divide by your actual productivity rate to get productive hours, divide that by your real utilisation rate to get paid hours, then divide by shift length for headcount. Finally add an absenteeism buffer, which matters in Indian warehouses relying on contract and migrant labour. Use fully loaded labour cost, including PF, ESIC, gratuity accruals and manpower agency fees, when converting headcount into a budget.

Kapil Pathak is a Senior Digital Marketing Executive with over six years of experience specializing in the logistics and supply chain industry. His expertise spans digital strategy, search engine optimization (SEO), search engine marketing (SEM), and multi-channel campaign management. He has a proven track record of developing initiatives that increase brand visibility, generate qualified leads, and drive growth for D2C & B2B technology companies.