Running a warehouse without tracking the right metrics is like driving with your eyes closed. You might be moving, but you have no idea if you’re heading in the right direction or straight into a wall.
Warehouse KPIs (Key Performance Indicators) are the compass that guides your operations toward efficiency, accuracy, and profitability. Whether you’re managing a small distribution center or a massive fulfillment operation, understanding which warehouse metrics to track can mean the difference between chaos and control.
In this comprehensive guide, we’ll walk through 15 essential warehouse performance metrics that every operations manager should monitor. You’ll learn what each KPI measures, how to calculate it, and most importantly—how to use these insights to build a powerful warehouse KPI dashboard that drives real results.
What Are Warehouse KPIs and Why Do They Matter?
Before diving into specific metrics, let’s clarify what we’re talking about. Warehouse KPIs are quantifiable measurements that help you evaluate how well your warehouse operations are performing against your business objectives.
Think of KPIs as your warehouse’s vital signs. Just like a doctor monitors heart rate, blood pressure, and temperature to assess health, warehouse managers track inventory accuracy, order fulfillment metrics, and warehouse productivity metrics to diagnose operational health.
Understanding the fundamentals of warehouse management systems is essential before implementing any KPI tracking program, as your WMS will be the primary source of performance data.
The Difference Between KPIs and Metrics
Here’s a question many people ask: What is the difference between warehouse KPIs and metrics?
All KPIs are metrics, but not all metrics are KPIs. A metric is simply any measurement you track, like the number of pallets moved in a day. A KPI, however, is a metric that’s directly tied to a strategic business goal. If your goal is to reduce operational costs, then cost per order warehouse becomes a KPI, not just a metric.
Why Tracking Warehouse Performance Metrics Is Critical
In India’s rapidly growing logistics sector, where ecommerce fulfillment demands are skyrocketing and competition is fierce, tracking the right warehouse management KPIs isn’t optional. It’s essential for survival.
Here’s what proper KPI tracking delivers:
- Visibility into operational bottlenecks before they become expensive problems
- Data-driven decision making instead of gut feelings
- Accountability across teams with clear performance targets
- Continuous improvement through measurable progress
- Cost reduction by identifying inefficiencies
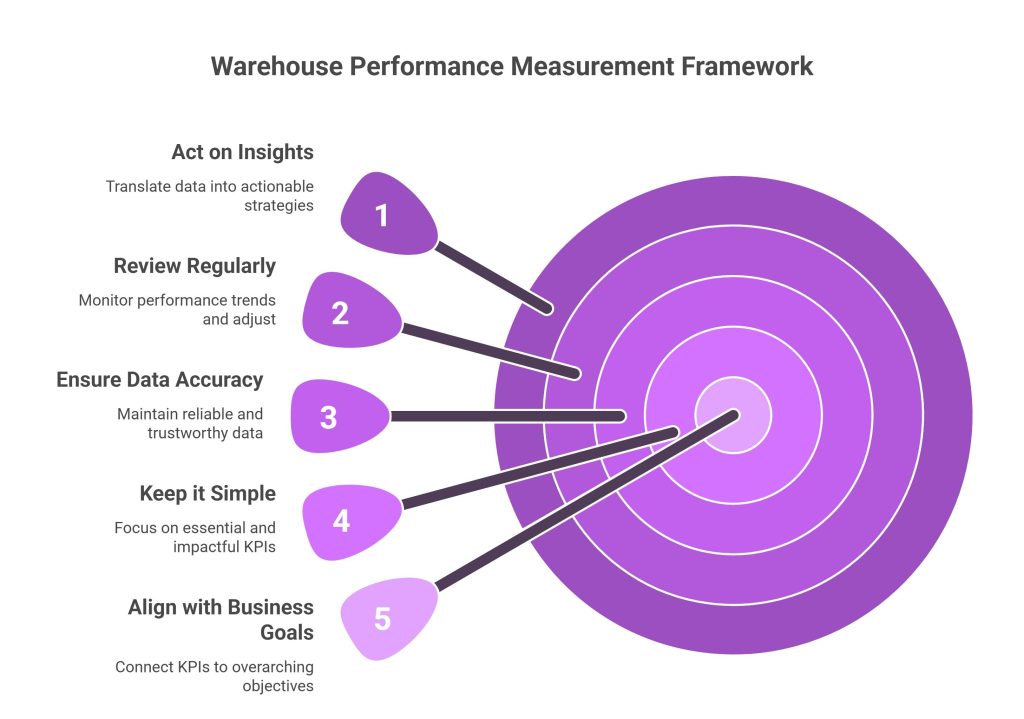
How to Measure Warehouse Performance: The Framework
Before we explore individual KPIs, you need a framework for how to measure warehouse performance effectively.
Follow these principles:
- Align with business goals – Every KPI should connect to a broader objective
- Keep it simple – Track what matters, not everything that moves
- Ensure data accuracy – Garbage in, garbage out
- Review regularly – Weekly for operational KPIs, monthly for strategic ones
- Act on insights – Data without action is just noise
How many KPIs should a warehouse track? Most experts recommend focusing on 10-15 core KPIs rather than drowning in dozens of metrics. Quality over quantity wins every time.
15 Essential Warehouse KPIs to Track
Let’s break down the most important KPIs for warehouse management, organized by category for clarity.
Category 1: Accuracy Metrics
1. Inventory Accuracy Rate
What it measures: The percentage of inventory records that match physical stock counts.
Why it matters: Inaccurate inventory leads to stockouts, overstocking, and frustrated customers. This is arguably the foundation of all warehouse operations. Many businesses struggle with common inventory management challenges that directly impact this critical metric.
Formula:
Inventory Accuracy = (Number of Accurate Items / Total Items Counted) × 100
Benchmark: World-class warehouses maintain 99%+ inventory accuracy. Anything below 95% indicates serious problems.
How to improve it:
- Implement regular cycle counting programs
- Use barcode scanning systems for all transactions
- Train staff on proper receiving and put-away procedures
- Deploy a robust WMS (Warehouse Management System)
Implementing barcode scanning systems can boost inventory accuracy from 85% to 99%+ by eliminating manual data entry errors.
2. Order Accuracy Rate
What it measures: The percentage of orders shipped without errors (wrong items, quantities, or addresses).
Why it matters: Every order error costs you money in returns, reshipping, and damaged customer relationships. In ecommerce, order accuracy percentage directly impacts customer satisfaction scores.
Formula:
Order Accuracy = (Perfect Orders / Total Orders Shipped) × 100
Benchmark: Target 99.5% order accuracy or higher. Even a 1% error rate means 10 mistakes per 1,000 orders.
Pro tip: Break this down further into picking accuracy rate, packing accuracy, and shipping accuracy to identify exactly where errors occur.
3. Picking Accuracy
What it measures: How often pickers select the correct items and quantities.
Why it matters: Picking errors are the most common source of order inaccuracies. Tracking order picking performance helps you identify training needs or process improvements. Different warehouse order picking methods impact your picking rate KPI significantly.
Formula:
Picking Accuracy = (Correct Picks / Total Picks) × 100
Benchmark: Aim for 99.8% picking accuracy with barcode verification systems.
Implementation insight: Modern WMS solutions with mobile scanning can dramatically improve this metric by providing real-time verification at the point of pick.
Category 2: Efficiency Metrics
4. Order Cycle Time
What it measures: The total time from order receipt to shipment.
Why it matters: In today’s same-day and next-day delivery world, speed matters. Faster order fulfillment metrics mean happier customers and more competitive service levels.
Formula:
Order Cycle Time = Order Ship Time - Order Receipt Time
Benchmark: For ecommerce operations, target 4-6 hours for standard orders. Express orders should ship within 2 hours.
What slows it down: Inefficient picking routes, poor inventory placement, manual processes, and inadequate staffing during peak periods.
5. Dock-to-Stock Time
What it measures: How long it takes to receive, inspect, and put away incoming inventory.
Why it matters: Slow receiving creates bottlenecks, delays inventory availability, and wastes valuable dock space. Receiving cycle time directly impacts your ability to fulfill orders.
Formula:
Dock-to-Stock Time = Put-Away Completion Time - Truck Arrival Time
Benchmark: Best-in-class operations achieve 2-4 hours for standard receipts.
Quick win: Pre-receiving through ASN (Advanced Shipping Notices) can cut this time by 30-40%.
6. Warehouse Throughput
What it measures: The volume of goods processed through your warehouse in a given period.
Why it matters: Warehouse throughput metrics indicate overall operational capacity and efficiency. It answers the question: “How much can we handle?”
Formula:
Throughput = Total Units Shipped / Time Period
Benchmark: This varies widely by industry, but track your trend over time. A 10-15% year-over-year improvement indicates healthy optimization.
Category 3: Productivity Metrics
7. Units Per Labor Hour
What it measures: How many units each warehouse worker processes per hour.
Why it matters: Labor productivity warehouse is often your largest controllable cost. This KPI helps you optimize staffing levels and identify training opportunities.
Formula:
Units Per Labor Hour = Total Units Processed / Total Labor Hours
Benchmark: This varies by operation type, but track individual and team performance against your baseline. Top performers often achieve 150-200 units per hour in picking operations.
Reality check: Don’t just chase higher numbers. Balance productivity with accuracy—rushing leads to errors.
8. Order Picking Rate
What it measures: The number of order lines picked per hour.
Why it matters: Picking typically consumes 50-60% of warehouse labor costs. Improving picking speed directly impacts your bottom line.
Formula:
Picking Rate = Total Lines Picked / Total Picking Hours
Benchmark: Manual picking: 60-80 lines/hour. RF-directed picking: 100-150 lines/hour. Voice picking: 120-180 lines/hour.
9. Warehouse Capacity Utilization
What it measures: The percentage of available warehouse space currently in use.
Why it matters: Space utilization rate helps you maximize your real estate investment and plan for expansion needs.
Formula:
Capacity Utilization = (Used Storage Space / Total Available Space) × 100
Benchmark: Target 85-90% utilization. Below 80% means wasted rent; above 95% creates operational constraints.
Strategic insight: Track this by zone (pallet racking, floor storage, mezzanine) to identify specific capacity issues.
Category 4: Cost Metrics
10. Cost Per Order
What it measures: The total warehouse operating cost divided by orders fulfilled.
Why it matters: This is your ultimate efficiency metric. Cost per order warehouse operations directly impact profitability and pricing competitiveness.
Formula:
Cost Per Order = Total Warehouse Operating Costs / Total Orders Fulfilled
Benchmark: For Indian ecommerce operations, target ₹40-80 per order depending on order complexity and volume.
Cost components include: Labor, rent, utilities, equipment, packaging materials, and technology systems.
11. Carrying Cost of Inventory
What it measures: The total cost of holding inventory, including storage, insurance, obsolescence, and capital costs.
Why it matters: Excess inventory ties up cash and warehouse space. Understanding carrying cost of inventory helps optimize stock levels.
Formula:
Carrying Cost = (Storage + Insurance + Obsolescence + Capital Cost) / Average Inventory Value × 100
Benchmark: Typically 20-30% of inventory value annually in India.
Category 5: Quality Metrics
12. Perfect Order Rate
What it measures: The percentage of orders delivered complete, on time, damage-free, and with accurate documentation.
Why it matters: This is the ultimate customer satisfaction metric. Perfect order percentage captures the entire fulfillment experience.
Formula:
Perfect Order Rate = (Orders Meeting All Criteria / Total Orders) × 100
Benchmark: World-class operations achieve 95%+ perfect order rates.
What kills this metric: Any single failure—late shipment, damaged goods, wrong item, missing invoice—makes the order imperfect.
13. Return Rate
What it measures: The percentage of shipped orders that customers return.
Why it matters: High return rates indicate quality issues, inaccurate product descriptions, or picking errors. Returns processing time also impacts warehouse efficiency.
Formula:
Return Rate = (Units Returned / Units Shipped) × 100
Benchmark: Ecommerce averages 15-30% depending on category. Fashion runs higher; electronics lower.
14. On-Time Shipment Rate
What it measures: The percentage of orders shipped by the promised date.
Why it matters: On-time shipment rate directly impacts customer satisfaction and repeat business. In B2B operations, late shipments can trigger financial penalties.
Formula:
On-Time Shipment = (Orders Shipped On Time / Total Orders) × 100
Benchmark: Target 98%+ on-time shipment for competitive operations.
15. Inventory Turnover Ratio
What it measures: How many times you sell and replace inventory in a period.
Why it matters: The inventory turnover ratio indicates how efficiently you’re managing stock. Higher turnover means less capital tied up and fresher inventory.
Formula:
Inventory Turnover = Cost of Goods Sold / Average Inventory Value
Benchmark: Varies by industry. FMCG: 12-15 times/year. Electronics: 6-8 times/year. Fashion: 4-6 times/year.
If your turnover is below industry benchmarks, explore proven strategies to improve inventory turnover and optimize your stock management.
How to Create a Warehouse KPI Dashboard
Now that you know what KPIs should warehouse managers track, let’s discuss how to create a warehouse KPI dashboard that actually gets used.
Essential Dashboard Design Principles
1. Visual hierarchy matters Place your most critical KPIs at the top. Use color coding (red/yellow/green) to show performance against targets instantly.
2. Real-time vs. historical data Include both current performance and trend lines. Seeing patterns over time reveals whether you’re improving or declining.
3. Drill-down capability Your dashboard should allow users to click into details. If order accuracy drops, you need to see which shift, which picker, or which product category is causing the problem.
4. Mobile accessibility Warehouse managers aren’t sitting at desks all day. Your warehouse analytics dashboard must work on tablets and smartphones.
Recommended Dashboard Tools
For small to medium operations:
- Microsoft Power BI – Excellent integration with Excel and SQL databases
- Google Data Studio – Free and user-friendly for basic dashboards
- Tableau – Powerful visualization capabilities
For enterprise operations:
- Most modern WMS platforms like Omneelab WMS include built-in analytics dashboards
- Custom solutions integrated with your ERP system
Need help choosing the right warehouse management solution that includes comprehensive KPI tracking? Consider factors like scalability, integration capabilities, and reporting features.
Dashboard Update Frequency
How often should warehouse KPIs be reviewed?
- Real-time monitoring: Order accuracy, picking rates, throughput (displayed on floor screens)
- Daily review: Productivity metrics, cost per order, on-time shipment
- Weekly analysis: Inventory accuracy, capacity utilization, labor efficiency
- Monthly strategic review: Inventory turnover, carrying costs, trend analysis
Common Mistakes in Warehouse KPI Tracking
Even with the right metrics, many warehouses fail to get value from their warehouse performance measurement system. Here are the pitfalls to avoid:
1. Tracking Too Many Metrics
More isn’t better. Focus on the warehouse metrics that matter most to your specific business goals. A cluttered dashboard leads to analysis paralysis.
2. Ignoring Context
A 95% order accuracy rate sounds good—until you realize your competitor achieves 99.5%. Always benchmark against industry standards and your own historical performance.
3. No Accountability
KPIs without ownership are just numbers. Assign specific team members responsibility for each metric and hold regular performance reviews.
4. Measuring Without Acting
The biggest waste? Collecting data and doing nothing with it. Every KPI review should end with action items and improvement initiatives.
5. Setting Unrealistic Targets
How to set warehouse KPI targets that motivate rather than demoralize? Start with your current baseline, research industry benchmarks, and set incremental improvement goals (5-10% quarterly improvements are realistic).
Implementing KPI Tracking in Indian Warehouse Operations
Indian warehouses face unique challenges that impact warehouse operations metrics:
Infrastructure constraints: Power reliability, internet connectivity in tier-2/3 cities Labor dynamics: High turnover rates, varying skill levels, seasonal workforce fluctuations Technology adoption: Many operations still rely on manual processes Regulatory compliance: GST documentation, FSSAI requirements for food, drug licensing for pharma
Practical Implementation Steps
Foundation (Months 1-2)
- Select 5-7 core KPIs aligned with your biggest pain points
- Establish baseline measurements
- Implement basic tracking systems (even Excel works initially)
Automation (Months 3-6)
- Deploy barcode scanning for inventory transactions
- Implement a basic WMS if you haven’t already
- Create automated data collection processes
Optimization (Months 6-12)
- Build comprehensive dashboards
- Establish regular review cadences
- Launch continuous improvement initiatives based on KPI insights
Small and medium warehouses can benefit from affordable WMS solutions for small businesses that include built-in analytics and don’t require massive upfront investments.
Technology Tools for Automated KPI Tracking
Manual KPI tracking is time-consuming and error-prone. Modern warehouse KPI software automates data collection and visualization.
Transitioning from manual to automated inventory management dramatically improves data accuracy and KPI tracking capabilities while reducing labor costs.
Essential Features to Look For
Real-time data integration: Connects with your WMS, ERP, and carrier systems Customizable dashboards: Adapts to your specific KPI requirements Mobile access: Enables on-floor decision making Alert systems: Notifies managers when KPIs fall below thresholds Historical trending: Shows performance patterns over time
Popular Solutions for Indian Markets
- Omneelab WMS: Comprehensive warehouse management with built-in analytics
- Zoho Analytics: Affordable cloud-based business intelligence
- SAP Business One: Enterprise-grade solution for larger operations
- Custom solutions: Many Indian tech companies build tailored dashboards
Conclusion: From Data to Action
Tracking warehouse KPIs and metrics isn’t about creating pretty charts it’s about driving continuous improvement that impacts your bottom line.
The warehouses that win in 2026 and beyond will be those that master the art of operational performance measurement. They’ll use real-time warehouse KPIs to make faster decisions, optimize resources, and deliver exceptional customer experiences.
Start small. Pick 5-7 KPIs from this list that address your biggest operational challenges. Establish baselines, set realistic targets, and review progress weekly. As you build momentum, expand your warehouse metrics dashboard to cover additional areas.
Remember: The goal isn’t perfect data—it’s better decisions.
If you’re struggling with inventory accuracy, order fulfillment speed, or operational costs, it’s time to implement a comprehensive KPI tracking system. Modern warehouse management solutions like Omneelab WMS provide built-in analytics dashboards that automatically track all 15 KPIs discussed in this guide.
Explore how Omneelab can help you build a data-driven warehouse operation →
Frequently Asked Questions
The five most critical warehouse management KPIs are inventory accuracy (measures stock record reliability), order accuracy (tracks fulfillment errors), cost per order (evaluates operational efficiency), on-time shipment rate (monitors delivery performance), and inventory turnover ratio (indicates stock management effectiveness).
Warehouse productivity is calculated using: Units Per Labor Hour = Total Units Processed / Total Labor Hours. For example, if your team processes 12,000 units in 80 labor hours, productivity is 150 units per hour. Best-in-class operations achieve 150-200 units per hour in picking operations.
World-class warehouses maintain 99%+ inventory accuracy, while 95-98% is acceptable for most operations. Anything below 95% indicates serious problems. Implement cycle counting, barcode/RFID scanning, and a robust WMS to achieve high accuracy.
Review operational KPIs (order accuracy, picking rates) in real-time or daily. Analyze productivity metrics weekly to identify trends. Conduct strategic reviews of financial KPIs (inventory turnover, carrying costs) monthly or quarterly with clear accountability for each metric.
A warehouse metric is any measurement you track (like pallets moved per day), while a warehouse KPI is a metric directly tied to strategic business goals. Focus on 10-15 core KPIs that drive business outcomes rather than tracking dozens of disconnected metrics.

Kapil Pathak is a Senior Digital Marketing Executive with over four years of experience specializing in the logistics and supply chain industry. His expertise spans digital strategy, search engine optimization (SEO), search engine marketing (SEM), and multi-channel campaign management. He has a proven track record of developing initiatives that increase brand visibility, generate qualified leads, and drive growth for D2C & B2B technology companies.