Running a business without understanding your inventory turnover ratio is like driving blindfolded – you might get somewhere, but you’ll probably crash along the way. If you’ve ever wondered whether your stock is moving fast enough or sitting around collecting dust, you’re asking the right questions.
The inventory turnover ratio isn’t just another boring financial metric that accountants obsess over. It’s actually one of the most telling indicators of how efficiently your business operates. Think of it as your business’s pulse – when it’s healthy, everything flows smoothly, but when it’s off, problems cascade throughout your entire operation.
In this comprehensive guide, we’ll break down everything you need to know about inventory turnover benchmarks, how to calculate inventory turnover ratio, and most importantly, what constitutes a good inventory turnover ratio for your specific industry in 2025.
Understanding Inventory Turnover Ratio: The Basics
What Is Inventory Turnover Ratio?
The inventory turnover ratio strategy measures how many times a company sells and replaces its inventory during a specific period, typically a year. It’s essentially a snapshot of how efficiently you’re converting your inventory investment into sales revenue.
Imagine you own a coffee shop. If you buy 100 bags of coffee beans at the beginning of the month and sell all of them by month’s end, then restock and sell another 100 bags, you’ve “turned over” your coffee inventory twice that month. That’s the basic concept behind stock turnover ratio.
The Inventory Turnover Formula
How do you calculate inventory turnover ratio? The inventory turnover formula is surprisingly straightforward:
Inventory Turnover Ratio = Cost of Goods Sold (COGS) ÷ Average Inventory Value
Here’s how to break it down:
- Cost of Goods Sold (COGS): The direct costs of producing or purchasing the goods you sold during the period
- Average Inventory Value: (Beginning Inventory + Ending Inventory) ÷ 2
Inventory Turnover Ratio Example
Let’s say your retail business had:
- COGS for the year: ₹41,50,000
- Beginning inventory: ₹4,15,000
- Ending inventory: ₹5,81,000
- Average inventory: (₹4,15,000 + ₹5,81,000) ÷ 2 = ₹4,98,000
Your inventory turnover ratio would be: ₹41,50,000 ÷ ₹4,98,000 = 8.33
This means you turned over your inventory about 8.33 times during the year, or roughly every 44 days (365 ÷ 8.33).
What Makes a Good Inventory Turnover Ratio?
Industry-Specific Benchmarks Matter
There’s no universal “perfect” number when it comes to inventory turnover benchmarks. What’s considered excellent for a furniture store might be terrible for a grocery store. The key is understanding your industry’s standards and average inventory turnover by industry.
What is the average inventory turnover for retail? Here are some general benchmarks:
- Grocery/Food: 10-20 times per year
- Clothing/Apparel: 4-6 times per year
- Electronics: 6-8 times per year
- Automotive parts: 4-6 times per year
- Furniture: 3-5 times per year
- Jewelry: 2-3 times per year
High vs. Low Inventory Turnover: The Trade-offs
Is a high inventory turnover ratio good or bad? Like most business metrics, context is everything.
Benefits of High Inventory Turnover Ratio:
- Better cash flow: Money isn’t tied up in stagnant inventory
- Reduced storage costs: Less warehouse space needed
- Lower risk of obsolescence: Products don’t sit around getting outdated
- Improved supply chain efficiency
Potential Drawbacks:
- Stockout risk: Running too lean might mean missing sales opportunities
- Higher ordering costs: More frequent orders can increase administrative expenses
- Reduced bulk purchase discounts: Smaller, more frequent orders might cost more per unit
When Low Inventory Turnover Might Be Acceptable:
- Seasonal businesses: Holiday decorations naturally turn slower
- Luxury goods: High-end items typically have longer sales cycles
- Custom products: Made-to-order items require different metrics
- New market entry: Building initial inventory levels takes time
Calculating and Interpreting Your Numbers
Step-by-Step Calculation Guide
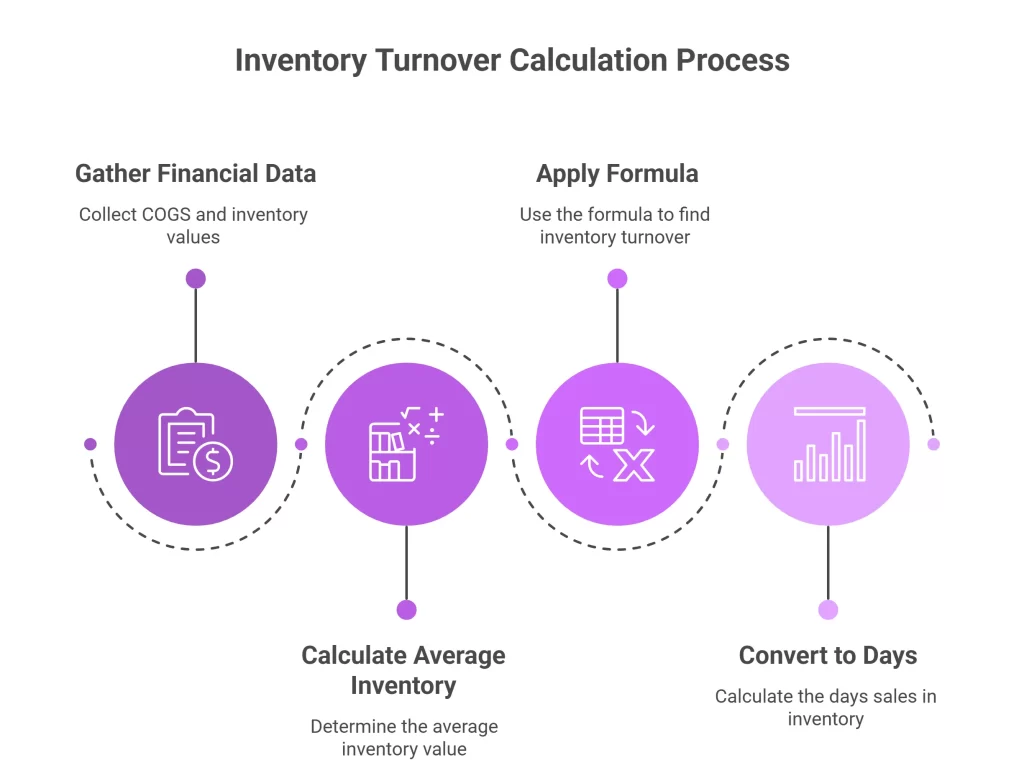
Let’s walk through a complete inventory turnover calculator process:
- Gather your financial data:
- Annual COGS from your income statement
- Beginning and ending inventory values from your balance sheet
- Calculate average inventory:
- For more accuracy, use monthly averages if available
- (Jan + Feb + Mar + … + Dec) ÷ 12
- Apply the formula:
- Inventory Turnover = COGS ÷ Average Inventory
- Convert to days:
- Days sales in inventory = 365 ÷ Inventory Turnover Ratio
- This tells you how many days it takes to sell your average inventory
Understanding Days Sales in Inventory
Days sales in inventory is often more intuitive than the turnover ratio itself. If your turnover ratio is 6, that means you cycle through inventory every 61 days (365 ÷ 6). This metric helps you understand your inventory performance in terms everyone can grasp.
Industry Analysis: What’s Normal in 2025?
Retail Industry Trends
The retail landscape has dramatically shifted, especially post-pandemic. Inventory turnover ratio by industry shows some interesting patterns:
Traditional Retail vs. E-commerce:
- Physical stores: 4-6 times annually
- E-commerce: 6-12 times annually (due to lower storage costs and better demand forecasting)
Omnichannel retailers often achieve the best inventory turnover ratio by leveraging both online and offline channels for faster stock rotation.
Manufacturing Considerations
Manufacturing businesses face unique challenges with inventory management metrics. They must balance:
- Raw materials inventory
- Work-in-process inventory
- Finished goods inventory
Each category may have different optimal turnover rates, making inventory efficiency ratio calculations more complex but equally important.
Factors Affecting Your Inventory Turnover
External Factors You Can’t Control
What causes low inventory turnover? Sometimes it’s beyond your direct influence:
- Economic downturns: Customers postpone purchases
- Seasonal fluctuations: Natural business cycles
- Supply chain disruptions: Global events affecting availability
- Market saturation: Too much competition
Internal Factors You Can Optimize
However, many factors are within your control:
Demand Forecasting
Poor forecasting leads to either stockouts or overstock situations. Modern inventory management systems use AI and machine learning to improve accuracy.
Product Mix Management
Not all products are created equal. The 80/20 rule often applies – 20% of your products generate 80% of your sales. Focus your inventory optimization efforts accordingly.
Pricing Strategy
Strategic pricing can accelerate stock rotation. Temporary promotions, bundle deals, and seasonal pricing adjustments all impact turnover rates.
Supplier Relationships
Strong partnerships enable more flexible ordering, shorter lead times, and better terms – all contributing to improved working capital management.
Strategies to Improve Your Inventory Turnover
How to increase inventory turnover effectively:
1. Implement Just-in-Time (JIT) Inventory
JIT reduces carrying costs and forces you to become more responsive to actual demand rather than forecasted demand.
2. Improve Demand Forecasting
Use historical data, seasonal trends, and market analysis to better predict what customers actually want.
3. Optimize Your Product Mix
How can I improve my inventory turnover ratio? Start by identifying slow-moving items and either promote them aggressively or discontinue them.
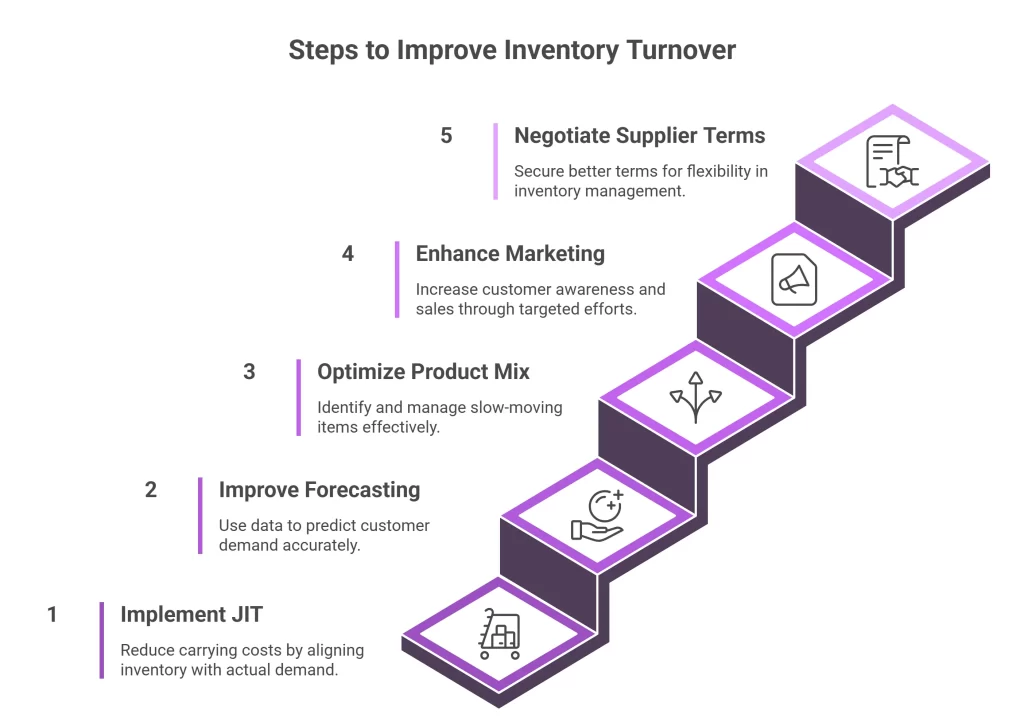
4. Enhance Marketing and Sales Efforts
Sometimes inventory sits because customers don’t know about it. Targeted marketing can significantly impact turnover rates.
5. Negotiate Better Supplier Terms
Shorter lead times and smaller minimum orders provide more flexibility to match inventory levels with actual demand.
Technology Solutions for Better Inventory Management
Modern inventory management best practices heavily rely on technology:
- Automated reordering systems
- Real-time inventory tracking
- Predictive analytics
- Integration with sales channels
These tools help maintain optimal inventory levels while maximizing cash flow optimization.
Red Flags: When Your Ratio Signals Problems
What is a bad inventory turnover ratio?
Warning signs include:
- Declining turnover over time: Even if your absolute number seems okay, negative trends are concerning
- Significantly below industry average: If competitors are turning inventory twice as fast, you’re at a disadvantage
- Extremely high turnover: While generally good, excessively high ratios might indicate chronic stockouts
Common Mistakes to Avoid
- Focusing solely on the ratio: Remember, it’s just one metric among many financial ratios
- Ignoring seasonality: Annual calculations might mask important seasonal patterns
- Comparing across different industries: A furniture store shouldn’t benchmark against a grocery store
- Neglecting profit margins: Fast turnover at low margins might not be better than slower turnover at high margins
The Connection to Other Financial Metrics
Working Capital Turnover Ratio
Inventory turnover ratio directly impacts your overall working capital management. Faster inventory turnover typically means:
- Less cash tied up in stock
- Better asset turnover
- Improved return on investment
Quick Ratio vs Inventory Turnover
While quick ratio vs inventory turnover measure different things, they’re related. The quick ratio excludes inventory from current assets, recognizing that inventory isn’t as liquid as cash or receivables.
Looking Ahead: 2025 Trends and Predictions
Technology’s Growing Impact
Artificial intelligence and machine learning are revolutionizing inventory optimization. Companies using advanced analytics typically achieve 10-20% better turnover ratios than those relying on traditional methods.
Sustainability Considerations
Environmental concerns are pushing businesses toward more efficient inventory performance. Reducing waste through better turnover isn’t just good business – it’s increasingly expected by consumers and regulators.
Supply Chain Resilience
Post-pandemic, many businesses are balancing efficiency with resilience. This might mean accepting slightly lower turnover ratios in exchange for reduced supply chain risks.
Conclusion: Making Inventory Turnover Work for You
Understanding what is inventory turnover ratio is just the beginning. The real value comes from consistently monitoring, analyzing, and optimizing this crucial business efficiency metric.
Remember, there’s no magic number that works for every business. Your good inventory turnover ratio depends on your industry, business model, market conditions, and strategic goals. The key is to:
- Know your industry benchmarks
- Track trends over time
- Balance efficiency with service levels
- Continuously optimize based on data
Ready to optimize your inventory management? Omneelab offers intelligent inventory management solutions designed to help businesses of all sizes track, analyze, and optimize their inventory control operations. Our platform seamlessly integrates into your existing workflow, enabling you to monitor stock levels, predict demand patterns, and maintain optimal turnover ratios—all from a single, intuitive dashboard.
With Omneelab’s advanced features, you can manage everything from raw materials and finished goods to equipment and supplies across multiple locations. Our system includes powerful capabilities like automated reorder points, predictive analytics, real-time reporting, customizable alerts, and mobile accessibility. Whether you’re in the warehouse, on the road, or working remotely, you can stay connected to your inventory data and make informed decisions instantly.
From startups establishing their first inventory processes to established enterprises seeking more efficient solutions, Omneelab transforms how companies approach inventory optimization. Our AI-powered technology eliminates guesswork, reduces carrying costs, and helps you achieve the perfect balance between stock availability and capital efficiency. Modern technology can automate much of the heavy lifting, allowing you to focus on strategic decisions rather than manual calculations.
Experience the Omneelab difference—schedule your personalized demo today.
Frequently Asked Questions (FAQs)
Most retail businesses should aim for 4-6 inventory turns per year, though this varies significantly by product category. Grocery stores might turn inventory 15-20 times annually, while furniture stores might only turn 3-4 times. The key is understanding your specific industry’s inventory turnover benchmark and optimizing accordingly.
Inventory turnover ratio directly impacts cash flow optimization because faster-moving inventory converts to cash more quickly. When you turn inventory 8 times per year instead of 4, you’re essentially doubling how quickly your invested capital returns to your bank account, improving overall working capital management.
Yes, extremely high inventory turnover ratio can indicate chronic stockouts, leading to lost sales and frustrated customers. While fast stock rotation is generally positive, you need to balance turnover speed with maintaining adequate safety stock to meet customer demand consistently.
For seasonal businesses, calculate both annual turnover and seasonal turnover rates. Use monthly average inventory value during peak seasons separately from off-seasons. This gives you a more accurate picture of your inventory performance throughout different business cycles and helps with more precise supply chain efficiency planning.
Inventory turnover ratio tells you how many times you cycle through inventory annually, while days sales in inventory converts this into days (365 ÷ turnover ratio). If your turnover is 6, your days sales in inventory is about 61 days. Both measure the same thing but days often feel more intuitive for inventory management decisions.
People Read About:

Kapil Pathak is a Senior Digital Marketing Executive with over four years of experience specializing in the logistics and supply chain industry. His expertise spans digital strategy, search engine optimization (SEO), search engine marketing (SEM), and multi-channel campaign management. He has a proven track record of developing initiatives that increase brand visibility, generate qualified leads, and drive growth for D2C & B2B technology companies.